Publicado em: 2023-08-09
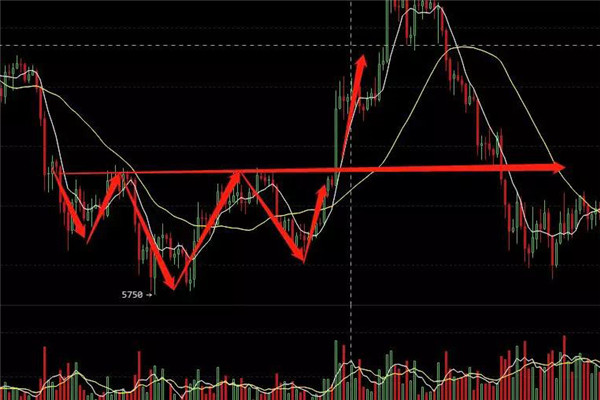
Head and Shoulder Top é um padrão gráfico usado em análise técnica para prever a reversão de tendências em ações, câmbio e outros mercados financeiros. É nomeado após sua forma semelhante à cabeça e ombros de uma pessoa, consistindo de três picos e dois vales. O padrão cabeça a ombro geralmente aparece no topo de uma tendência ascendente, indicando que os preços estão prestes a cair.

A formação do padrão cabeça-ombro-topo requer três estágios. Em primeiro lugar, na fase do ombro esquerdo, os preços sobem para um pico e depois caem, formando o primeiro vale. A próxima etapa é a fase principal, onde os preços sobem novamente para um pico mais alto e depois caem novamente, formando uma segunda calha, que geralmente é menor do que a calha no ombro esquerdo. Finalmente, na fase do ombro direito, o preço sobe novamente, mas não atinge o ponto alto na cabeça, e depois cai novamente, formando uma terceira calha, que geralmente é semelhante à calha no ombro esquerdo.
The important feature of the head-shoulder top pattern is the neck line, which is a horizontal line connecting the left shoulder and the low valley of the head. When the price falls below the neckline, it is seen as an important selling signal, indicating that the price will further decline. Investors usually use the neck line of the head-to-shoulder pattern as a signal line to trigger selling or short selling.
The effectiveness of the head-shoulder-top mode depends on the integrity of its form and the confirmation of trading volume. The integrity of the pattern means that the high and low points of each stage are clearly visible and meet the shape requirements of the pattern. The confirmation of trading volume means that during the formation of the head-to-shoulder pattern, trading volume should exhibit a certain pattern, such as relatively low trading volume in the head stage.
Although the head shoulder top model is widely used in technical analysis, not all head shoulder top models can successfully predict price declines. Therefore, when using the head-shoulder-top model for trading decisions, investors should conduct comprehensive analysis based on other technical indicators and market trends to improve the accuracy and success rate of transactions.
The effectiveness of the head-shoulder-top mode lies in the breakthrough of the neck line. When the price drops below the neckline level, the pattern is confirmed, and investors usually adopt a selling strategy, expecting the price to continue to decline. The downward break of the neckline is considered an important selling signal, which can trigger more selling orders and accelerate the downward trend.
The emergence of the head-to-shoulder top model is often seen as a shift in market sentiment from buying to selling. It reflects the trend of gradually weakening long positions and increasing short positions in the market. The formation of the head-shoulder top pattern takes a certain amount of time, usually a few months, and is therefore considered a long-term trend reversal pattern.
The predictive ability of the head-shoulder-top model depends to a certain extent on the liquidity of the market and the behavior of participants. In situations with high liquidity and a large number of market participants, the head-to-shoulder top model may have stronger predictive power. However, in situations of low liquidity and fewer market participants, the effectiveness of the head-to-shoulder model may decrease.
The head-shoulder top mode is not absolutely accurate; sometimes prices may rebound before breaking through the neckline, or the downward movement of the neckline may be temporary. Investors should be cautious when using the head-to-shoulder top model and conduct comprehensive analysis in conjunction with other technical indicators and market trends to make more accurate decisions.
Aviso: Investimento envolve risco. O conteúdo deste artigo não é um conselho de investimento e não constitui nenhuma oferta ou solicitação de oferta ou recomendação de qualquer produto de investimento.