公開日: 2023-08-09
更新日: 2025-01-13
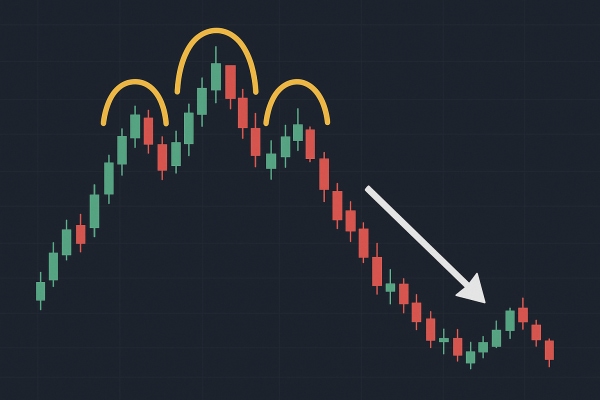
三尊天井(ヘッドアンドショルダー)は、株式、FX、その他の金融チャートにおけるトレンドの反転を予測するために使用されるパターンです。名前の英語「Head and shoulder」は、このチャートパターンが人の頭(head)と肩(shoulder)の形に似ていることに由来しており、3つのピークと2つの谷から成り立っています。三尊天井(ヘッドアンドショルダー)は通常、上昇トレンドの頂点に現れ、価格が下落する兆候を示します。
の逆面ー逆三尊(ヘッドアンドショルダーボトム)")
三尊天井(ヘッドアンドショルダー)形成には、3つの段階があります。まず、左の「天井」の段階では、価格がピークに達した後、再び下落して最初の谷を形成します。次に、ピークの段階では、価格が再び上昇してより高いピークに達し、その後再び下落して2番目の谷を形成します。この谷は通常、左の「天井」の谷よりも低くなります。最後に、右の「天井」の段階では、価格が再び上昇しますが、ピークの高点には達せず、その後再び下落して3番目の谷を形成します。この谷は通常、左の「天井」の谷と似たような形になります。
三尊天井(ヘッドアンドショルダー)の重要な特徴は、ネックラインです。これは、左肩と頭部の谷を結ぶ水平線です。価格がネックラインを下回ると、重要な売りシグナルと見なされ、価格がさらに下落する兆候とされます。投資家は通常、三尊天井(ヘッドアンドショルダー)のネックラインを売却や空売りの引き金として使用します。
三尊天井パターンの効果は、その形の完全性と取引量の確認に依存します。形の完全性とは、各段階の高値と安値が明確に確認でき、パターンの形状要件を満たしていることを意味します。取引量の確認とは、三尊天井(ヘッドアンドショルダー)の形成中に取引量が特定のパターンを示すことを指します。例えば、頭部段階では取引量が比較的少ないことがよくあります。
三尊天井(ヘッドアンドショルダー)はテクニカル分析で広く使用されていますが、すべてが価格の下落を正確に予測できるわけではありません。そのため、投資家はこのパターンを取引の意思決定に使用する際、他のテクニカル指標や市場動向に基づいて総合的に分析し、取引の精度と成功率を高めるべきです。
三尊天井(ヘッドアンドショルダー)の有効性は、ネックラインの突破にあります。価格がネックラインレベルを下回ると、パターンが確認され、投資家は通常、価格がさらに下落すると予測し、売り戦略を採用します。ネックラインの下方突破は重要な売りシグナルと見なされ、さらなる売り注文を引き起こし、下落トレンドを加速させることができます。
三尊天井(ヘッドアンドショルダー)の出現は、市場のセンチメントが買いから売りにシフトしたことを示すものと見なされることが多いです。これは、市場におけるロングポジションの弱まりとショートポジションの増加を反映しています。形成には一定の時間がかかり、通常は数ヶ月を要するため、長期的なトレンド反転パターンと考えられています。
三尊天井(ヘッドアンドショルダー)の予測能力は、ある程度市場の流動性や参加者の行動に依存します。流動性が高く、市場参加者が多い状況では、そのパターンの予測力が強くなることがあります。しかし、流動性が低く、参加者が少ない状況では、その効果が低下することがあります。
三尊天井(ヘッドアンドショルダー)は絶対的に正確ではなく、時には価格がネックラインを突破する前に反発することや、ネックラインの下方移動が一時的であることもあります。投資家はこのパターンを使用する際には慎重に、他のテクニカル指標や市場動向と組み合わせて総合的に分析し、より正確な意思決定を行うと良いでしょう。
免責事項: この資料は一般的な情報提供のみを目的としており、信頼できる財務、投資、その他のアドバイスを意図したものではなく、またそのように見なされるべきではありません。この資料に記載されている意見は、EBCまたは著者が特定の投資、証券、取引、または投資戦略が特定の個人に適していることを推奨するものではありません。