게시일: 2023-08-09
수정일: 2025-01-07
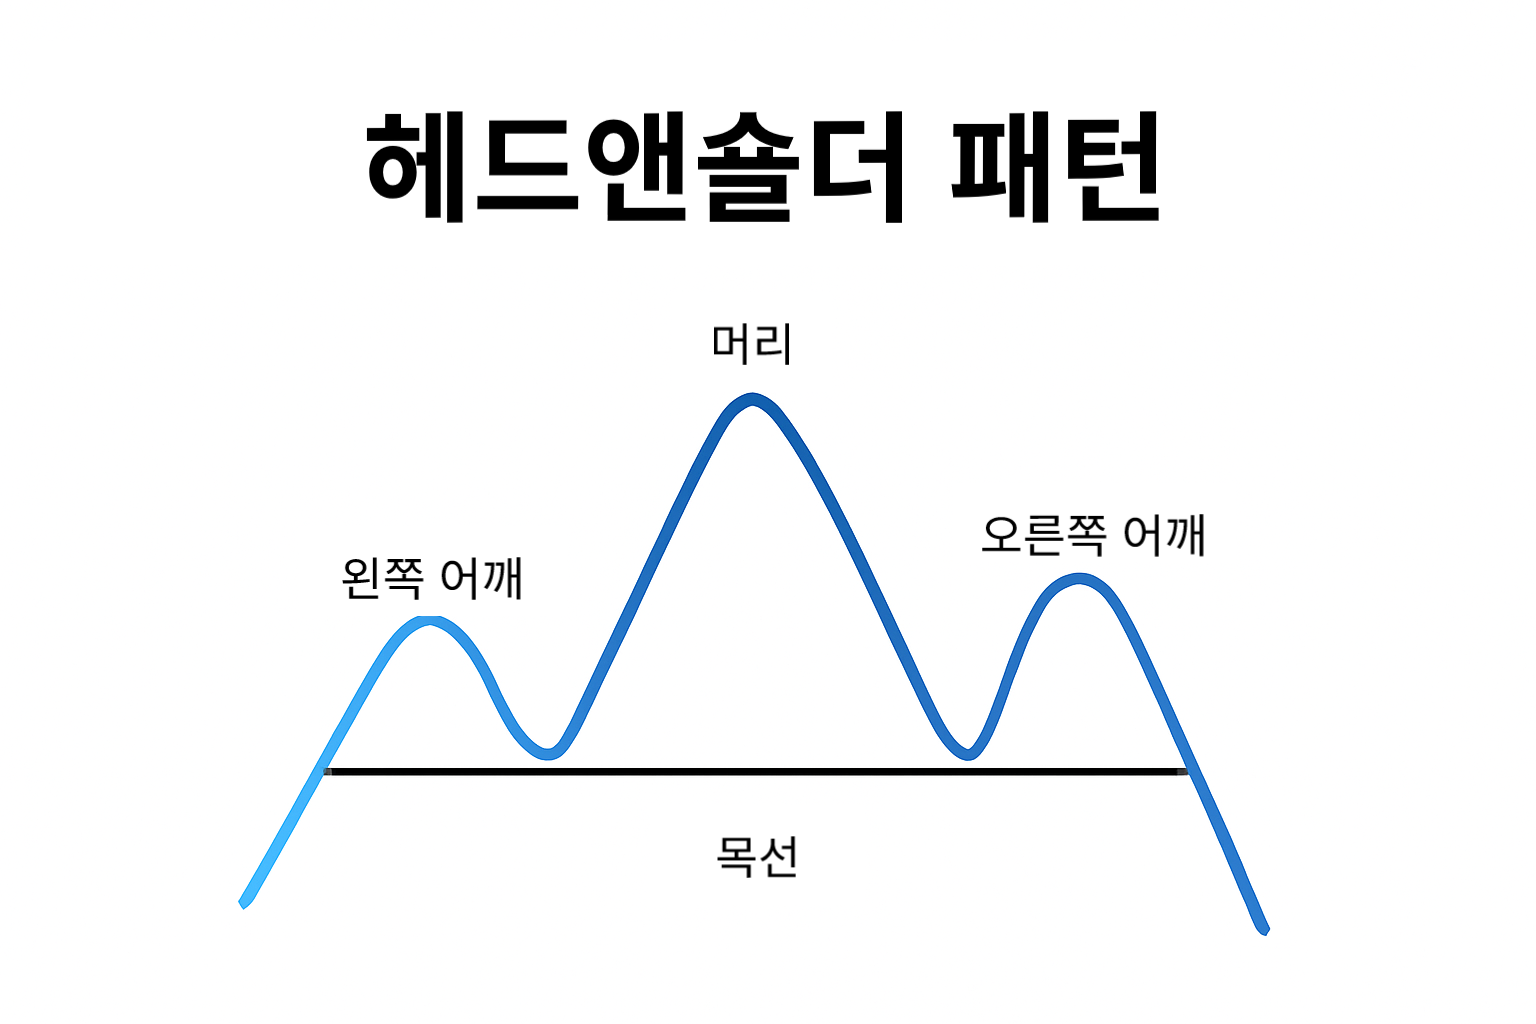
헤드 앤 숄더 패턴은 주식, 외환 및 기타 금융 시장에서 추세 반전을 예측하는 데 사용되는 그래프 패턴입니다. 이 패턴은 사람의 머리로 보이는 가운데 봉우리와 어깨처럼 보이는 양쪽 봉우리, 그리고 '목선'을 형성하는 두 개의 저점으로 구성되어있습니다. 헤드 앤 숄더 패텉은 보통 상승 추세가 끝나고 가격이 하락할 것을 예고할 때 나타납니다.

헤드 앤 숄더 패턴의 형성은 세 가지 단계를 거쳐 이루어집니다. 첫 번째 단계는 '왼쪽 어깨'가 형성되는 단계로, 가격이 고점으로 상승한 후 다시 떨어지며 목선(neckline)으로 이어집니다. 그 다음 단계는 '머리'가 형성되는 단계로, 약간의 조정을 거친 시장이 더 높은 고점을 형성합니다. 마지막 단계에선 '오른쪽 어깨'가 형성되며, 머리에서 떨어진 가격이 상승하며 이전 고점과 비숫한 수준의 고점에 도달합니다. 그리고 가격이 목선 아래로 하락 돌파 시 패턴이 완성되는 것입니다.
헤드 앤 숄더 패턴의 가장 큰 특징 중 하나가 바로 '목선(neckline)'입니다. 목선은 어깨와 머리 사이의 저점을 연결한 선으로, 가격이 목선 아래로 떨어지면 매도 신호로 봐야 합니다. 이는 가격이 더 하락할 것임을 예고하는 것으로, 투자자들은 보통 이 목선을 기준으로 매도 또는 공매도를 실행합니다.
헤드 앤 숄더 패턴을 잘 활용하기 위해선 패턴의 완전성과 거래량을 주시해야 합니다. 패턴의 완전성에 대해선 각 단계의 높은 지점과 낮은 지점을 명확하게 표시하고, 패턴의 형상이 완전이 나타났는지를 확인해야 합니다. 거래량에 관해서는 헤드 앤 숄더 패턴이 형성될 때 거래량이 일정한 패턴을 보였는지 확인해야 합니다. 머리 단계에선 상대적으로 낮은 거래량이 나타났는지 등등 말입니다.
헤드 앤 숄더 패턴은 기술적 분석에서 널리 사용됩니다. 하지만 모든 헤드 앤 숄더 패턴이 가격 하락을 정확하게 예측하는 것은 아닙니다. 그렇기 때문에 이 패턴을 사용해 거래 결정을 내릴 땐 다른 기술적 지표와 시장 동향을 종합적으로 분석해서 거래의 정확도와 성공률을 높여야 합니다.
헤드 앤 숄더 패턴의 가장 큰 효용은 목선 돌파 확인에 있습니다. 가격이 목선 아래로 떨어지면 패턴이 확정되며, 투자자들 대부분은 가격이 하락할 것을 예측해 매도 전략을 채택하여 수익성을 보장할 수 있습니다. 목선의 하향 돌파는 중요한 매도 신호이며, 추가적인 매도 주문을 유발하고 하락 추세를 가속화할 수도 있습니다.
헤드 앤 숄더 패턴이 나타나면 시장 심리가 매수에서 매도로 전환되는 경향이 있습니다. 이는 시장에서 롱 포지션이 점차 약해지고 숏 지션이 증가하는 추세가 나타나기 때문입니다. 헤드 앤 숄더 패턴은 형성되기까지 일정 기간이 걸리며, 보통은 수개월이 소요되므로 장기적인 추세 반전 패턴으로 간주됩니다.
헤드 앤 숄더 패턴의 예측 능력은 시장의 유동성과 시장 참가자의 행동에 일정 부분 영향을 받습니다. 유동성이 높고 시장 참가자가 많은 상황에서는 예측 정확도가 올라가나, 그 반대의 경우 패턴의 효용이 다소 감소할 수 있습니다.
헤드 앤 숄더 패턴의 예측은 절대적이지도 완벽히 정확하지도 않습니다. 가격이 목선을 돌파하기 전 반등한다거나, 목선 하락 돌파가 일시적인 경우도 종종 발생합니다. 따라서 헤드 앤 숄더 패턴을 활용한 거래 전략은 신중해야 하며, 다른 기술적 지표와 시장 동향을 종합적으로 분석하여 보다 정확한 결정을 내리는 것이 바람직합니다.
[본 자료는 정보 제공을 목적으로 하며 어떠한 금융 및 투자에 대한 조언이 아닙니다. 자료에 제시된 어떠한 의견도 특정 투자, 보안, 거래 또는 투자 전략이 특정 개인에게 적합하다는 EBC 또는 작성자의 권장 사항이 아님을 명시합니다.]