Published on: 2026-06-26
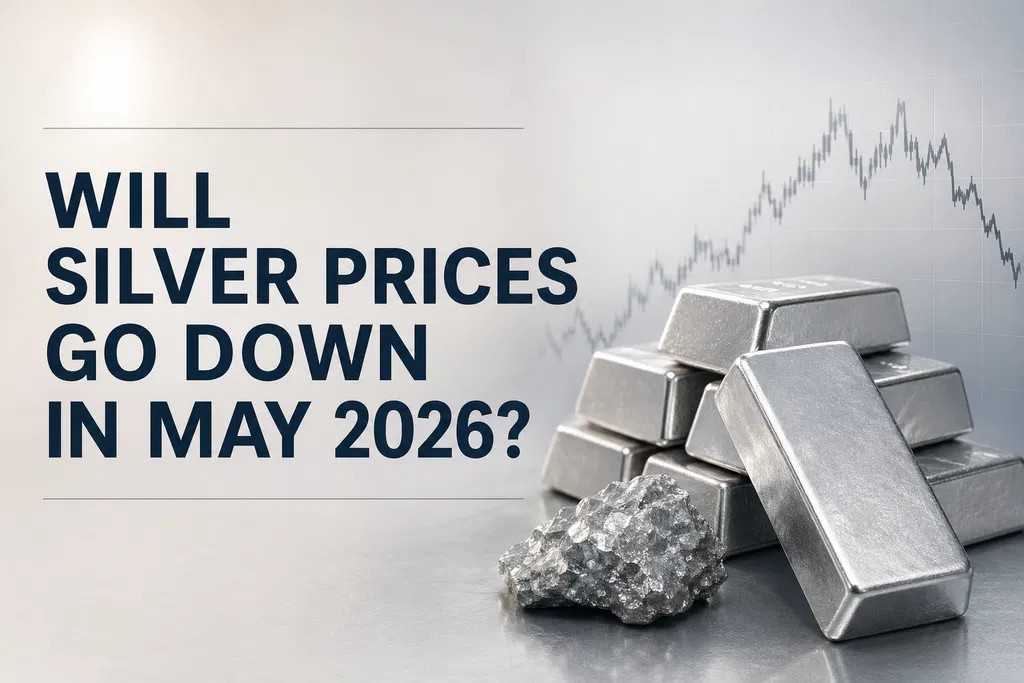
Silver traded near $56.50 on June 26, 2026, a seven-month low and about 47% below its January all-time high of $121.62. The metal lost roughly 12% in two trading days and about 26% over the past month.
The drop is mainly due to investors pulling their money out, even though real-world demand for silver continues. Now, markets see an 83% chance of a Fed rate hike by December, which is a big change from the rate-cut expectations six months ago. The US dollar is also at a one-year high near 101.80.
According to the Silver Institute’s World Silver Survey 2026, there is a sixth consecutive annual deficit, now at 46.3 million ounces. Since 2021, 762.1 million ounces have been taken from above-ground stocks. Factory demand is also weakening, with solar demand down 19%, jewelry down 16%, and silverware down 20%.
The gold-silver ratio has risen to about 68.6 from 50 in January, showing that silver has dropped much faster than gold. Demand for Western coins and bars is expected to rise 20% to a three-year high of 227 million ounces, which suggests that lower prices are attracting physical buyers again.
On June 26, 2026, silver was trading near $56.50, its lowest in seven months. The price has fallen about 47% from its January record of $121.62, with about 12% of that loss happening in just two days this week. The Silver Institute also confirmed a sixth straight year of shortage, with the 2026 deficit growing to 46.3 million ounces.
Even though silver is in its biggest shortage in modern times, the price is acting as if there are no buyers. This makes more sense when you look at the two main factors that drive silver’s price, which are not just about how much silver is used worldwide.

In five months, silver lost all the gains it made during most of 2025, with the sharpest drop happening in the last week of June.
| Date | Silver (per oz) | What was happening |
|---|---|---|
| Late January 2026 | $121.62 record high | First sustained break above $100; gold-silver ratio at 50, a 14-year low |
| April 17 | ~$79 | World Silver Survey 2026 released, deficit confirmed |
| June 3 | ~$74 | Sticky inflation, war premium still in price |
| June 15 | $70.38 | Gold-silver ratio at 61.7 |
| June 23 | $62.03 | Dollar index breaks 100 |
| June 24 | ~$59 close at $58.09 | Below $60 for the first time since December; roughly 5% single-day drop |
| June 25 | ~$57 | Seven-month low; PCE inflation data due |
| June 26 | ~$56.50 | Testing the December 4 low of $56.45 |
So far this year, silver is down about 13%, even though it started 2026 above $100. Since the January peak, it has lost nearly half its value. Both the price drop and the ongoing shortage are real, which is why the situation seems confusing at first.
Silver does not pay any interest. It just stays in a vault, a coin tube, or a fund, earning nothing while you hold it. This means it competes with cash and government bonds for investors’ money. When cash offers little return, silver looks appealing, but when cash pays 4% to 5%, holding silver with no yield feels costly.
Six months ago, markets thought the Federal Reserve would cut interest rates several times in 2026. Now, that expectation has completely changed. After Fed Chair Kevin Warsh showed a strong commitment to lowering inflation, traders began to expect an 83% chance of a rate hike by December. The US Dollar Index also rose to about 101.80, its highest in over a year.
Expectations of higher rates affect silver in two ways. First, higher returns on cash, with the 10-year Treasury yield nearing 4.48% and real yields around 2.2%, draw money away from metals and into income investments. Second, a stronger dollar makes silver more expensive for buyers outside the US.
The US-Iran ceasefire on June 14 also removed the war premium, sending oil prices back to pre-conflict levels and reducing the inflation fears that had supported precious metals. With these three supports gone, silver, which pays no yield, took the full impact.
To understand silver, you need to see that it has two main roles. One is monetary: investors buy silver as a store of value, and this demand changes with interest rates, the dollar, and inflation fears. The other is industrial: factories use silver to make solar panels, electronics, and electric vehicles, so demand for it depends on the real economy.
These two forces rarely move together. The January jump to $121 was driven by a strong monetary backdrop, with war, inflation, and a physical shortage attracting investors. The current drop is due to a weakening in the monetary side, as interest rates and the dollar have moved against silver.
Meanwhile, the industrial demand continues steadily in the background. Factories keep making solar panels even if the Fed is expected to raise rates, and they do not sell off their silver stocks just because the dollar is stronger. This steady industrial demand gives silver a price floor that metals used only for investment lack, even when prices are falling sharply.
Silver is a small market, which explains its big price swings. The total value of silver mined each year is much less than gold and tiny compared to global stocks and bonds. This means even a small change in investor money can move silver’s price much more than it would in a bigger market.
Most silver price changes happen through paper trading, not actual metal. One COMEX futures contract equals 5,000 ounces, and the number of contracts traded daily is much higher than the amount of real silver exchanged. This means traders’ moves in these paper positions set the daily price, so investment sentiment can outweigh the slow-moving physical shortage in the short term.
This week, forced selling added more pressure. A big drop in US tech stocks and a crypto market that has lost over half its value since late 2025 led some investors to sell whatever they could to raise cash and cover losses. In this rush for liquidity, investors sell the assets they can, which is why silver, even in shortage, can fall 12% in two days. Silver also tends to move two to three times more than gold in both directions, so when gold fell below $4,000 this week, silver dropped even more.
In 2026, the deficit increased to 46.3 million ounces from 40.3 million in 2025, marking the sixth year in a row that more silver was used than produced. Since 2021, this ongoing shortfall has removed 762.1 million ounces from above-ground stocks, which is almost nine months of total global mine output.
Factory demand is actually going down, which changes who is keeping the market in shortage. Solar panel makers cut their silver use by 6% in 2025 and plan to cut another 19% in 2026, down to about 151 million ounces, because silver’s share of a solar cell’s cost rose from about 8% to over 20% during the price rally. Jewelry demand is expected to fall 16% to a five-year low, and silverware demand is down about 20%. High prices have led buyers to use less.
As factories reduce their demand, investors are now the main reason for the ongoing shortage. Physical coin and bar demand went up 14% in 2025 and is expected to rise another 18% in 2026, with US retail buying set to jump 57%. This is the same investor money that left the market this week, which helps explain how a 'record shortage' and a 'crashing price' can occur at the same time. The shortage now depends on buyers who are most likely to leave when interest rates go up.
Normally, a record shortage would bring more silver to the market, but silver supply hardly responds to its own price. About 70% of the world’s silver is produced as a byproduct of mining gold, copper, lead, and zinc, so the amount mined depends more on demand for those metals than on silver’s price.
Mine output stayed around 813 million ounces in 2025 and is slowly rising to 820 million in 2026, but total supply is expected to drop about 2% as last year’s recycling boom fades. Mexico, Peru, and China are the top producers, and most of their silver comes from base-metal mines that do not focus on silver. Starting a new primary silver mine takes over eight years from discovery to production, so a shortage found in 2026 cannot be fixed with new metal this decade.
In London, silver available for immediate delivery dropped to a record-low 17% of total vault stock in September 2025, causing lease rates to spike in October. By the end of March 2026, that share recovered to 28%, but Metals Focus says this recovery is real but fragile.
COMEX registered inventories show a similar trend, falling from a peak of 531 million ounces in October 2025 to about 315 million, with 95 million ounces leaving the US in the first two months of 2026.
Silver is now clearly oversold, meaning the selling has been fast and deep. The 4-hour Relative Strength Index is near 20, a level that often signals the end of a big move rather than the start of a new one. The price is testing its December 4 low of about $56.45, which buyers are trying to defend.
It is easy to see the next price levels from here. If silver falls below $56.45, it could drop to the mid-$54 range, with the next major support at the November 21 low near $48.64. On the upside, resistance is near $61.40, then around $67, and the 20-day moving average at about $68.09 is the key level silver needs to regain to show the trend has changed.
The gold-silver ratio sums up the bigger picture. It shows how many ounces of silver are needed to buy one ounce of gold, and it has risen to about 68.6 from 50 at silver’s January peak. A ratio in the 60 to 70 range is close to the long-term average, so silver has moved from being expensive compared to gold to about fair value. In the past, this range has often come just before silver starts to outperform again.
The near term belongs to the dollar and the Fed, not the shortage. The next signal is the Personal Consumption Expenditures inflation report, the Fed’s preferred gauge, with headline inflation expected near 4.1% year over year and core near 3.4%. A hot print hardens the case for a hike and keeps pressure on silver; a soft print is the first thing that could let the metal breathe.
Lower prices are already boosting demand. Western coin and bar demand is expected to rise 20% to a three-year high of 227 million ounces, as retail buyers see the price drop as a buying opportunity.
Three industrial sectors are also growing to fill the gap left by solar, since electric vehicles use 25 to 50 grams of silver compared to 15 to 28 grams in gasoline cars, and AI data centers and power grid expansion are adding new demand that did not exist five years ago. China remains a steady support, having installed a record 315 gigawatts of solar in 2025, increased silver jewelry demand by 5%, and kept its central bank buying gold for 18 months in a row.
For the long term, the key question is whether today’s efforts to use less silver per panel will turn into full substitution, where copper replaces silver completely. Copper is being tested in the leading TOPCon solar design, but it still has reliability issues, and mass adoption is not expected until around 2028 to 2030. This means the current reductions in silver use could still be reversed. The same dollar-forces behind this sell-off also affect energy and reserve markets, as discussed in EBC’s analysis of the shift from the petrodollar to the petroyuan.
June 2026 shows that the shortage sets a floor for silver’s price, but the Fed and the dollar decide its day-to-day moves. Silver dropped to $56 as investment money that had pushed it to $121 quickly left after rate-hike odds jumped to 83% and the dollar reached a one-year high. A tech-stock selloff also forced more selling to raise cash. Now, the metal that the world still cannot produce enough of is selling at a discount, and the big question is whether lower prices will bring back enough physical buyers to match the silver that supply cannot provide.