Bearish divergence is a technical analysis concept signalling a potential reversal from an uptrend to a downtrend.
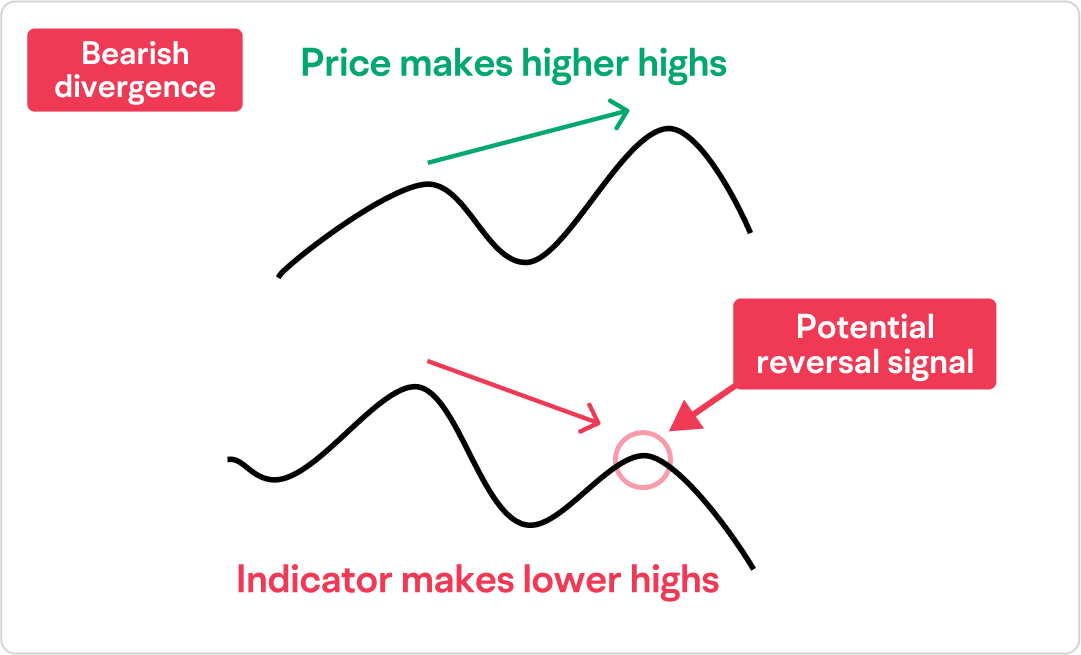
It occurs when an asset's price reaches higher highs while a momentum indicator, such as the Relative Strength Index (RSI) or Moving Average Convergence Divergence (MACD), forms lower highs.
This discrepancy suggests weakening momentum despite rising prices, indicating that the bullish trend may be losing strength. Understanding this concept can enhance trading strategies and risk management.
What Is Bearish Divergence

In technical analysis, divergence refers to the price of an asset and a technical indicator moving in opposite directions.
Bearish divergence arises during an uptrend when the asset's price records higher peaks, but the momentum indicator fails to mirror this movement, instead showing lower peaks.
This pattern suggests that while the price is climbing, the underlying buying pressure diminishes, potentially leading to a price reversal. Traders interpret this as a sign that a bearish move may be forthcoming.
How to Identify
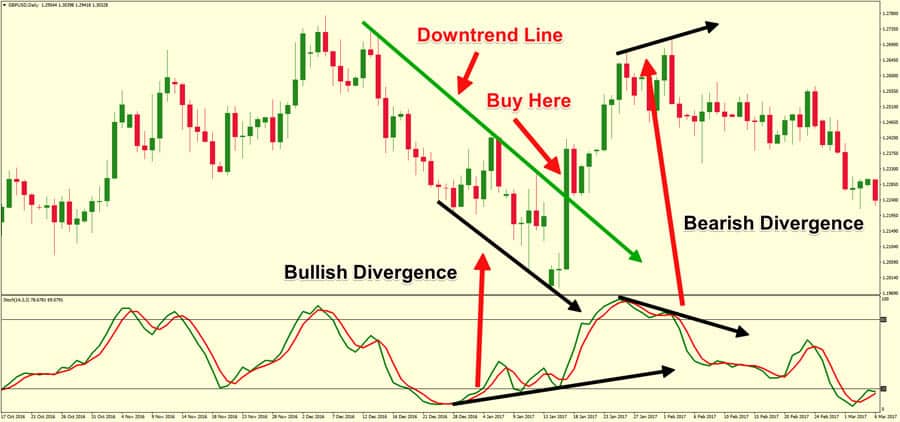
As mentioned, traders analyse price charts alongside momentum indicators like RSI or MACD to spot bearish divergence. They look for instances where the price reaches new highs, but the indicator fails to do the same, instead forming lower highs. This divergence between price and indicator can signal a potential trend reversal.
For example, if a stock's price climbs to a new high, but the RSI peaks at a lower level than before, this could indicate that the upward momentum is waning, and a bearish reversal might be forthcoming.
Types of Bearish Divergence

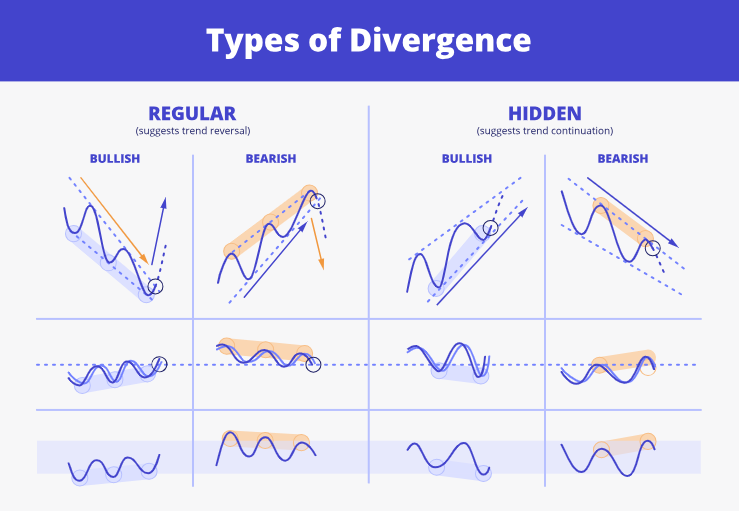
1. Regular Bearish Divergence
Regular bearish divergence is observed during an uptrend when the price has higher highs, but the momentum indicator records lower highs. This pattern suggests that the upward momentum is waning, and a reversal to a downtrend may occur.
2. Hidden Bearish Divergence
A hidden bearish divergence occurs when the price forms lower highs, but the momentum indicator shows higher highs. This indicates that the prevailing downtrend will continue, serving as a signal for trend continuation rather than reversal.
3. Exaggerated Bearish Divergence
Exaggerated bearish divergence happens when the price forms equal highs, but the momentum indicator forms lower highs. This pattern suggests a potential reversal, although considered less reliable than regular divergence.
Bearish Divergence Importance in Trading
Recognising bearish divergence is crucial for traders as it can present early warning signs of a potential trend reversal. By identifying this pattern, traders can make informed decisions, such as tightening stop-loss orders, taking profits, or avoiding new long positions.
However, it's important to note that divergence signals are not always accurate predictors of trend reversals. They should be used with other technical analysis tools and indicators to confirm signals and reduce the likelihood of false positives.
Bearish Divergence Strategies

1. Confirm with Additional Indicators
Before acting on a bearish divergence signal, confirm it with other technical indicators or chart patterns to increase reliability.
2. Monitor Volume
A decrease in volume during higher price highs can support the bearish divergence signal, indicating weakening buying pressure.
3. Set Stop-Loss Orders
Implementing stop-loss orders above recent highs can protect against unexpected market movements if the anticipated reversal does not occur.
4. Use Multiple Time Frames
Analysing bearish divergence across different time frames can provide a more comprehensive view and reduce false signals.
Practical Application
In practice, traders use bearish divergence to anticipate potential downturns in asset prices. For instance, if a trader observes that a stock's price is making higher highs while the MACD histogram forms lower highs, they might interpret this as a bearish divergence signal. Consequently, the trader could decide to exit long positions or initiate short positions, anticipating a price decline.
It is essential to combine divergence analysis with other technical indicators to enhance the reliability of trading decisions, such as support and resistance levels, candlestick patterns, and volume analysis.
Limitations and Risks
While bearish divergence can be a valuable tool in technical analysis, it has limitations. Not all divergence signals lead to significant trend reversals; sometimes, they may result in minor price corrections or no changes. Therefore, relying solely on divergence without additional confirmation can lead to false signals and potential losses.
Moreover, divergence patterns can persist for extended periods before a reversal occurs, making timing challenging. Traders should exercise caution and use risk management strategies to mitigate potential downsides.
Conclusion
In conclusion, bearish divergence is a valuable tool in a trader's arsenal to provide insights into potential trend reversals and aid in risk management.
However, it's imperative to use divergence analysis to navigate the complexities of financial markets effectively in conjunction with other tools and maintain disciplined risk management.
Disclaimer: This material is for general information purposes only and is not intended as (and should not be considered to be) financial, investment or other advice on which reliance should be placed. No opinion given in the material constitutes a recommendation by EBC or the author that any particular investment, security, transaction or investment strategy is suitable for any specific person.


