A leading indicator is a crucial economic metric used to forecast future trends in economic activity. These indicators typically encompass various economic variables such as stock market indices, money supply, construction permits, and employer confidence indexes. Their significance lies in their ability to anticipate changes in economic activity before they actually occur.
Utilizing leading indicators enables decision-makers and investors to gain insights into upcoming economic trends, facilitating more informed decision-making. It's important to note that while leading indicators are valuable tools, they are not infallible predictors, as economic activity is influenced by a multitude of factors. Therefore, it's advisable to consider a combination of indicators and factors to gain a more comprehensive understanding of economic forecasts.

The relationship between economic phenomena is tightly interwoven, notably through economic indicators that form a sequential time series. For instance, fluctuations in raw material prices typically precede changes in finished product costs, and advancements in education often come before progress in science and technology, which in turn precedes advancements in production and construction.
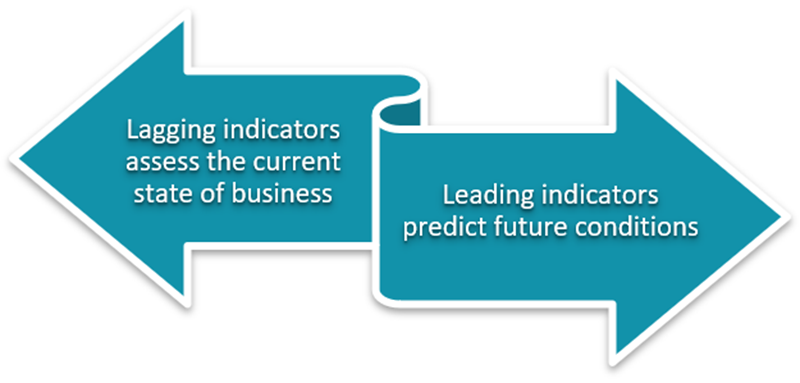
The leading indicator method categorizes economic time series into three types based on their temporal relationships: leading indicators, synchronous indicators, and lagging indicators. Leading indicators forecast changes in synchronous or lagging indicators, making them crucial for predicting economic trends and turning points. This method applies to both microeconomic and macroeconomic forecasts, enabling accurate predictions and informed decision-making.
In economic analysis, indicators are classified based on their timing relative to predicted changes. Leading indicators anticipate peaks or troughs before the predicted event, offering early signals of potential economic shifts. Synchronous indicators, on the other hand, align precisely with predicted changes, reflecting simultaneous movements in economic trends. Lagging indicators trail behind the predicted event, confirming trends after they have already occurred. To forecast economic trends effectively using these indicators, analysts first identify relevant leading indicators aligned with their forecasting goals. They then plot these indicators alongside synchronous and lagging indicators on a time series diagram to visualize their temporal relationships. This structured approach enables analysts to make informed predictions based on the sequential patterns observed.
【 EBC Platform Risk Reminder and Disclaimer 】: There are risks in the market, and investment needs to be cautious. This article does not constitute investment advice.


