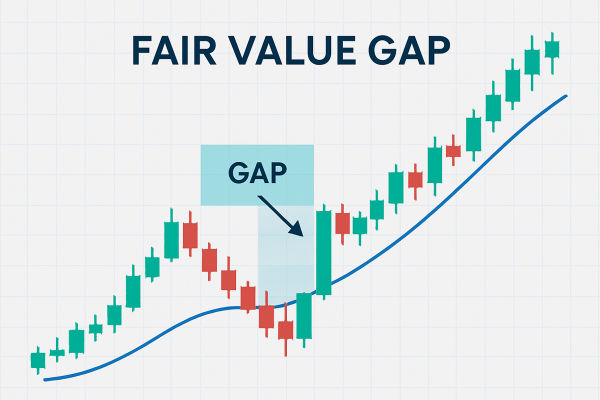
Looking to improve your day trading success? Understanding the best patterns for day trading is crucial. In this guide, we’ll break down the top patterns every trader should know and how to apply them effectively.
Key Takeaways
Mastering essential day trading patterns like Bullish Flags, Bearish Flags, and Symmetrical Triangles can enhance traders’ ability to predict price movements and identify profitable entry points.
Reversal patterns including Head and Shoulders, Inverse Head and Shoulders, and Double Tops and Bottoms are crucial for recognizing trend shifts in the market, allowing traders to adjust their strategies accordingly.
Effective risk management techniques such as setting stop-loss orders, strategic position sizing, and maintaining emotional discipline are vital for preserving capital and ensuring long-term trading success.
Essential Day Trading Pattern

Day trading patterns help in understanding market dynamics and making strategic trading decisions. These patterns offer insights into market psychology and potential price movements, enabling traders to make reasonable predictions on price trends. Mastering these Chart Patterns allows traders to identify profitable entry points, benefit from price movements, and increase their chances of success.
Chart patterns such as triangles and flags offer opportunities to predict price movements. These stock chart patterns can serve as valuable tools for traders. They assist in interpreting market conditions and making informed decisions based on pattern implications. Waiting for these patterns to fully form before entering a trade significantly improves the probability of success.
Every day trader should learn critical day trading patterns to maximize potential profits. Three essential patterns to focus on are the Bullish Flag Pattern, Bearish Flag Pattern, and Symmetrical triangle pattern.
1. Bullish Flag Pattern
The bullish flag pattern is one of the most popular chart patterns among traders. Characterized by a sharp price movement followed by a consolidation phase, this continuation pattern signals that the upward trend is likely to continue. To trade this pattern effectively, look for a flagpole formed by a strong upward movement, followed by a consolidation phase resembling a flag. Monitoring for an upcoming breakout and increased trading volume can confirm the pattern and indicate a continuation of the bullish trend.
Traders should enter a trade when the price breaks above the flag's upper boundary, ideally accompanied by a surge in trading volume. Setting stop-loss orders just below the flag's lower boundary helps manage risk and limit potential losses. This approach allows traders to capitalize on the bullish flag pattern and optimize their strategy for trend continuation.
2. Bearish Flag Pattern
The bearish flag pattern is the inverse of the bullish flag and signals potential selling opportunities. This pattern is characterized by a downward trend followed by a slight upward consolidation, which forms the flag. Traders should look for a flagpole formed by a downtrend, followed by slight upward consolidation, and anticipate a downside breakout. This pattern helps determine when to enter a short position, set a stop loss, and anticipate expected profit.
Effectively trading the bearish flag pattern involves waiting for a downside breakout, ideally accompanied by increased trading volume, to confirm the pattern. Setting stop-loss orders above the flag's upper boundary helps manage risk and protect against potential losses.
Using the bearish flag pattern helps traders optimize their strategies for bearish trend continuation.
3. Symmetrical Triangle Pattern
The symmetrical triangle pattern is another common chart pattern that traders should be familiar with. It is characterized by two converging trend lines connecting price swing highs and lows with equal slopes, forming a triangle shape. This pattern often indicates a period of consolidation before a breakout and can signal a continuation of the prevailing trend.
Traders should wait for confirmation of a breakout, as the price can move in either direction. A breakout from the upper trendline usually indicates a bullish trend, while a breakout from the lower trendline suggests a bearish trend. Rising trading volume following the breakout can signal a likely continuation of the trend.
Trading the symmetrical triangle pattern enhances the ability to predict and capitalize on market movements.
Reversal Patterns You Should Know
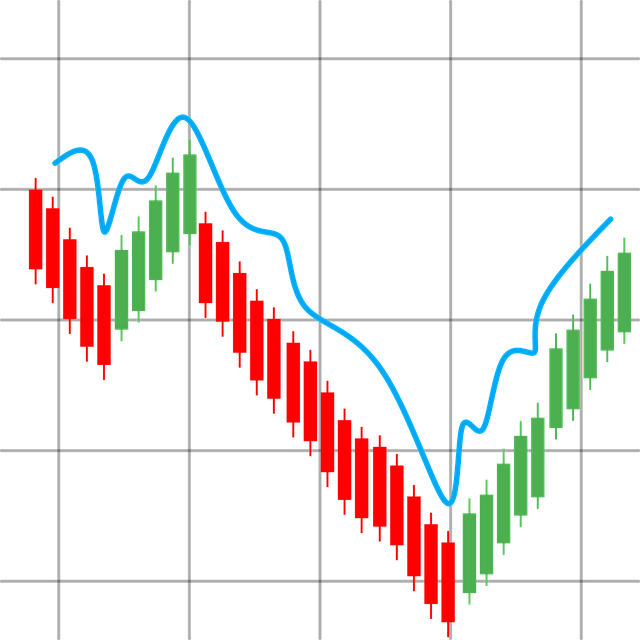
Reversal patterns are crucial for identifying potential trend reversals and making informed trading decisions. These patterns indicate a shift in market sentiment and can signal the end of a prevailing trend and the beginning of a new one. Reversal patterns help traders anticipate trend reversals and adjust their strategies accordingly.
Three key reversal patterns that every trader should know are the Head and Shoulders Pattern, Inverse Head and Shoulders Pattern, and Double Top and Double Bottom Patterns. These patterns offer important insights into market dynamics. They assist traders in pinpointing the best entry and exit points.
Mastering these reversal patterns enables traders to navigate market movements better and capitalize on opportunities. Details on each pattern and effective trading methods will be explored.
1. Head and Shoulder Pattern
The head and shoulders pattern is one of the most well-known and reliable reversal patterns. It indicates a bearish reversal signal and signifies a shift from bullish to bearish sentiment. The pattern is formed by three vertices: a left shoulder, a head, and a right shoulder, with a neckline connecting the lows of the two shoulders.
Traders should look for increased volume during the rise of the first shoulder and head, and decreased volume during the drops. Confirmation of the pattern occurs with increased volume during the breakdown below the neckline.
Once the price breaks and consolidates below the neckline, it signals to open sell trades. Set the price target for a short position by measuring the distance from the head to the neckline and projecting that distance downward from the breakdown point.
2. Inverse Head and Shoulder Pattern
The inverse head and shoulders pattern is the bullish counterpart to the head and shoulders pattern. It serves as a bullish reversal indicator, suggesting a shift from a downtrend to an uptrend. The pattern consists of three troughs: a left shoulder, a head, and a right shoulder, with a neckline connecting the highs of the two shoulders. Confirmation of the inverse head and shoulders pattern occurs when the price breaks above the neckline with increased volume.
Traders often target a price increase equal to the height of the head from the neckline. Trading the inverse head and shoulders pattern helps traders capitalize on bullish trend reversals and optimize their strategies.
3. Double Top and Double Bottom Patterns
The double top and double bottom patterns are classic reversal patterns that signal potential trend reversals. A double top pattern typically signals a reversal from bullish to bearish, indicating that buying pressure is weakening. In this pattern, the price fails to exceed a previous high, forming two peaks at similar levels.Conversely, a double bottom pattern indicates a potential shift in trend from bearish to bullish. It is characterized by two troughs at similar levels, suggesting that selling pressure is weakening and a reversal is likely.
Traders can manage risk effectively by setting stop-loss orders above the resistance level in a double top pattern or below the support level in a double bottom pattern.
Candlestick Patterns for Day Trading
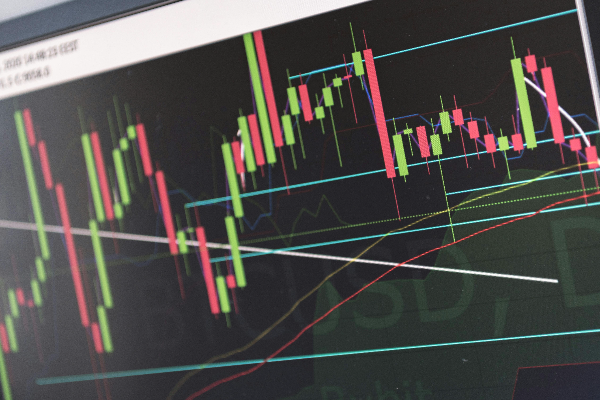
Candlestick patterns are essential tools for visualizing market sentiment and potential price movements. They provide valuable insights into market psychology and can indicate potential reversals or continuations. By mastering candlestick patterns, traders can enhance their ability to make informed trading decisions and capitalize on market opportunities.
Some of the most effective candlestick patterns in day trading include the Bullish Engulfing Pattern, Bearish Engulfing Pattern, and doji candlestick Pattern. These patterns can be identified using Japanese candlesticks and offer clear signals about market sentiment and potential price trends.
Using these candlestick patterns significantly improves a trader's ability to navigate financial markets and make profitable trades. Each of these patterns and their applications in day trading will be explored.
1. Bullish Engulfing Pattern
The bullish engulfing pattern is a powerful reversal pattern that signals a potential upward movement. The pattern includes a small bearish candle. This small candle is followed by a larger bullish candle that fully engulfs it. This pattern typically appears at the end of a downward trend, indicating that bulls are taking control from bears and a reversal is likely.
Traders should look for a small upper wick on the engulfing candle, which indicates potential upward momentum. Trading the bullish engulfing pattern allows traders to capitalize on upward trend reversals and optimize their strategies for profitable outcomes.
2. Bearish Engulfing Pattern
The bearish engulfing pattern is the inverse of the bullish engulfing pattern and signals a potential downward reversal. This pattern consists of a small bullish candle followed by a larger bearish candle that engulfs the first. It indicates that bears are taking control from bulls, suggesting a potential decline in price, forming a bearish reversal pattern.
The bearish engulfing pattern is confirmed when the price declines below the low of the engulfing candle. This indicates a potential trend reversal. Traders can improve the accuracy of this pattern. They can achieve this by combining it with other technical indicators.
Using the bearish engulfing pattern helps traders optimize their strategies for bearish trend reversals.
3. Doji Candlestick Pattern
The doji candlestick pattern is a neutral indicator that suggests market indecision and potential trend reversals. It typically resembles crosses or plus signs, indicating that the opening and closing prices are very close or equal. This pattern can signify potential reversals when used with other technical indicators.
Traders should look for doji patterns in conjunction with other indicators to enhance the accuracy of Trading signals for trend reversals. Utilizing the doji candlestick pattern helps traders better navigate market movements and capitalize on opportunities.
Continuation Patterns to Track
Continuation patterns are crucial for aligning trading strategies with prevailing market trends. These trend continuation patterns indicate that the current trend is likely to continue, providing traders with opportunities to capitalize on sustained market movements.
Some of the most important continuation patterns to track include the Ascending Triangle Pattern, Descending Triangle Pattern, and Pennant Pattern. These patterns help traders identify optimal entry points and align their strategies with the market's direction.
Mastering these continuation patterns enhances the ability to predict market trends and make profitable trades. Each of these patterns and their applications in day trading will be explored.
1. Ascending Triangle Pattern
The ascending triangle pattern is a bullish continuation pattern characterized by a horizontal upper trendline and an upward-sloping lower trendline. A minimum of two swing highs for the upper Trend Line and two swing lows for the lower trend line are needed to draw an ascending triangle. This pattern typically signals an upcoming breakout towards an upside trend, making it a valuable tool for traders.
Once the price reaches the resistance level and reverses, forming rising lows, traders should look for an increase in volume to confirm the breakout. Entering a long position when the price breaks above the top of the ascending triangle can be profitable.
On the other hand, entering short if it breaks below the lower trendline is also a viable strategy. Profit targets are calculated by adding or subtracting the triangle's height from the breakout point.
2. Descending Triangle Pattern
The descending triangle pattern is a bearish continuation pattern recognized by lower highs and a horizontal support line. This chart formation typically follows a downtrend and indicates that demand for the asset is weakening. Traders should look for a series of lower highs converging towards a horizontal support line to identify this pattern.
When the price breaks below the lower support line, it usually indicates a continuation of the bearish trend. Traders often take short positions after this breakdown, expecting the price to decline rapidly.
Using the descending triangle pattern helps traders align their strategies with bearish market trends and optimize outcomes.
3. Pennant Pattern
The pennant pattern forms after a strong price movement and typically indicates a continuation of that trend. This pattern is characterized by converging trend lines that form a small symmetrical triangle, known as the pennant. It signifies a brief period of consolidation before the preceding trend resumes.
A breakout from the pennant pattern is expected to follow the direction of the preceding trend, making it a valuable signal for traders. Trading the pennant pattern enables traders to capitalize on strong trend continuations and enhance strategies.
Intergrating Technical Indicator with Charts Patterns

Combining chart patterns with technical indicators enhances traders' ability to identify high-probability trading opportunities. Technical indicators like the Relative Strength Index (RSI), Moving Average Convergence Divergence (MACD), and Stochastic Oscillator (Stoch) are recommended for validating chart patterns and helping traders make informed decisions.
Incorporating risk management strategies alongside pattern recognition can prevent false signals and enhance overall trading effectiveness. Common types of continuation patterns, such as triangles, flags, pennants, and rectangles, are often used in conjunction with technical indicators.
Integrating these tools improves the ability to predict market movements and make profitable trades. Using Moving Averages, RSI, and Volume Analysis alongside chart patterns will be explored.
1. Moving Averages
Moving averages are essential tools in day trading that help smooth out price data to identify trends. Traders use moving averages to confirm chart patterns, as a crossover can indicate the strength of the pattern. For instance, a price crossing above the moving average can signal an upward trend, while a crossover below can indicate a downward trend.
Moving averages effectively aid in deciding exit points, particularly when the price starts to decline below the moving average. Incorporating moving averages into trading strategies enhances the ability to make informed decisions based on price movements.
2. Relative Strength Index (RSI)
The Relative Strength Index (RSI) is a momentum oscillator that measures the speed and change of price movements, helping traders assess whether a financial instrument is overbought or oversold. RSI is calculated using the average gains and average losses over a specified period, typically 14 days, resulting in a value that ranges from 0 to 100.
Traders use RSI to validate chart patterns by confirming potential reversal or continuation signals. For example, a divergence between RSI and price can indicate an impending reversal. Identifying overbought conditions occurs when RSI is above 70, suggesting potential price declines, while oversold conditions below 30 indicate possible price increases.
Incorporating RSI into analysis enhances the ability to predict market movements.
3. Volume Analysis
Volume analysis is crucial for traders as it provides insights into market strength and helps in validating price movements. Higher trading volumes often signify increased interest in a security, which can lead to more reliable price movements. Technical analysis of chart patterns such as flags or triangles requires confirmation through volume to ensure their validity.
A breakout from a pattern supported by strong volume is more likely to sustain the trend than one lacking volume confirmation. Tracking volume trends can reveal whether a security is gaining momentum or losing traction.
Divergences between price movements and volume can suggest potential reversals or weakening trends. Incorporating volume analysis into trading strategies enhances the ability to make informed decisions based on market sentiment.
Risk Management in Day Trading
Effective risk management prevents substantial losses that can erase previous trading profits. Risk management techniques are essential for preserving traders’ capital and reducing potential losses. Effective risk management in day trading is pivotal for protecting capital and minimizing losses.
In cryptocurrency trading, patterns may exhibit more volatility, necessitating adjustments in risk management strategies. Three key risk management techniques will be explored: setting stop-loss orders, position sizing, and managing emotional discipline.
1. Setting Stop-Loss Orders
Stop-loss orders help to limit potential losses if the market moves against your position. Setting stop losses in day trading limits potential losses when trades go against predictions. Setting stop-loss orders at strategic levels protects capital and minimizes the impact of adverse market movements.
Effective use of stop-loss orders involves placing them at levels where the price is unlikely to reach unless the trend is truly reversing. This helps ensure that minor fluctuations do not trigger the stop loss prematurely, allowing traders to stay in profitable trades longer.
2. Position Sizing
Position sizing is crucial in trading as it helps determine how much capital should be allocated to each individual trade. Position sizing is determined by assessing account size, risk tolerance, and the potential loss per trade. Calculating the potential loss per trade is essential for determining the appropriate position size, ensuring that the risk remains within tolerable levels.
Having a well-defined position sizing strategy is integral to minimizing losses and managing overall trading risk effectively. Appropriately sizing positions ensures no single trade significantly impacts the overall portfolio.
3. Managing Emotional Discipline
A strategic Trading plan helps maintain emotional discipline, reducing impulsive trading decisions. Maintaining emotional control is essential to prevent rash decisions that could deviate from the trading strategy. Adhering to a well-defined trading plan helps traders avoid the pitfalls of emotional trading and stay focused on long-term goals.
Developing techniques for managing stress and maintaining discipline helps traders remain calm and make rational decisions, even in volatile market conditions. This ultimately contributes to more consistent and profitable trading outcomes.
Practical Application and Examples
Day trading patterns can be applied in stock markets, currency pairs, and cryptocurrencies. Maximizing profits in trades often involves determining the optimal exit point after applying trading patterns. Patterns such as head and shoulders are commonly used by traders to predict potential reversals.
Analyzing day trading patterns on lower timeframes is crucial as it captures the micro-movements that are essential for trading success. Demo accounts allow traders to apply patterns in real-market conditions without facing financial risks.
Real-world examples of applying day trading patterns in different markets will be provided.
1. Case Study: Profiting from Bullish Flag Pattern
Successful trades using the bullish flag pattern involve clear entry points right after the price breaks above the flag's upper boundary. The bullish flag pattern is a continuation pattern that indicates the potential for further upward movement in price after a strong rally. Traders should strategically exit trades at predefined resistance levels or when signs of weakness are detected in price action.
Effective risk management involves setting stop-loss orders just below the flag's lower boundary to limit potential losses. Following these strategies helps traders maximize profits and minimize risks when trading the bullish flag pattern.
2. Example: Navigating a Head and Shoulders Reversal
Identifying a head and shoulders pattern involves recognizing the three peaks, where the middle peak is the highest. The head and shoulders pattern is a significant reversal pattern that signals a potential bearish market shift. Once the pattern is confirmed, traders execute a sell order at the neckline break.
Key practices include setting stop-loss orders and determining an appropriate exit strategy after executing the trade. Effectively navigating the head and shoulders pattern helps traders capitalize on trend reversals and optimize their strategies.
3. Applying Patterns in Cryptocurrency Trading
Due to the high volatility in cryptocurrency markets, traders often rely on chart patterns to make quick decisions on trades. Traders in the cryptocurrency market adapt strategies from other financial markets to navigate their specific price movements effectively. Cryptocurrency markets are known for their high volatility, presenting unique challenges for traders.
Understanding and applying chart patterns in cryptocurrency trading helps traders navigate the market's volatility and capitalize on opportunities. This involves adapting traditional trading strategies to fit the unique characteristics of cryptocurrency markets.
Mastering day trading patterns is essential for any trader looking to improve their trading outcomes. By understanding and utilizing patterns such as the Bullish Flag, Bearish Flag, Symmetrical Triangle, Head and Shoulders, Inverse Head and Shoulders, Double Top and Bottom, and various candlestick patterns, traders can anticipate market movements and make informed decisions. Integrating technical indicators, applying risk management techniques, and analyzing real-world examples further enhance trading strategies. Armed with this knowledge, traders can confidently navigate the financial markets and achieve consistent profitability.
Disclaimer: This material is for general information purposes only and is not intended as (and should not be considered to be) financial, investment, or other advice on which reliance should be placed. No opinion given in the material constitutes a recommendation by EBC or the author that any particular investment, security, transaction, or investment strategy is suitable for any specific person.


