Recently, EBC Finance saw intelligent trading engineer Mika on YouTube Yeap truthfully records the operational effects and conclusions of different trading strategies on Chartmaster, providing some reference for investors exploring the trading path.
EBC Finance brings together the multidimensional perspectives of global traders, helping investors build a more complete trading logic and cognition.
Chartmaster is a trading strategy simulation and backtesting tool established by Mika, which can simulate the operation of different strategies at different times. Analyze how profitable it is and where the problem is. He used Chartmaster to test strategies at different time periods for many years and discovered the phenomenon of "strategy decay".
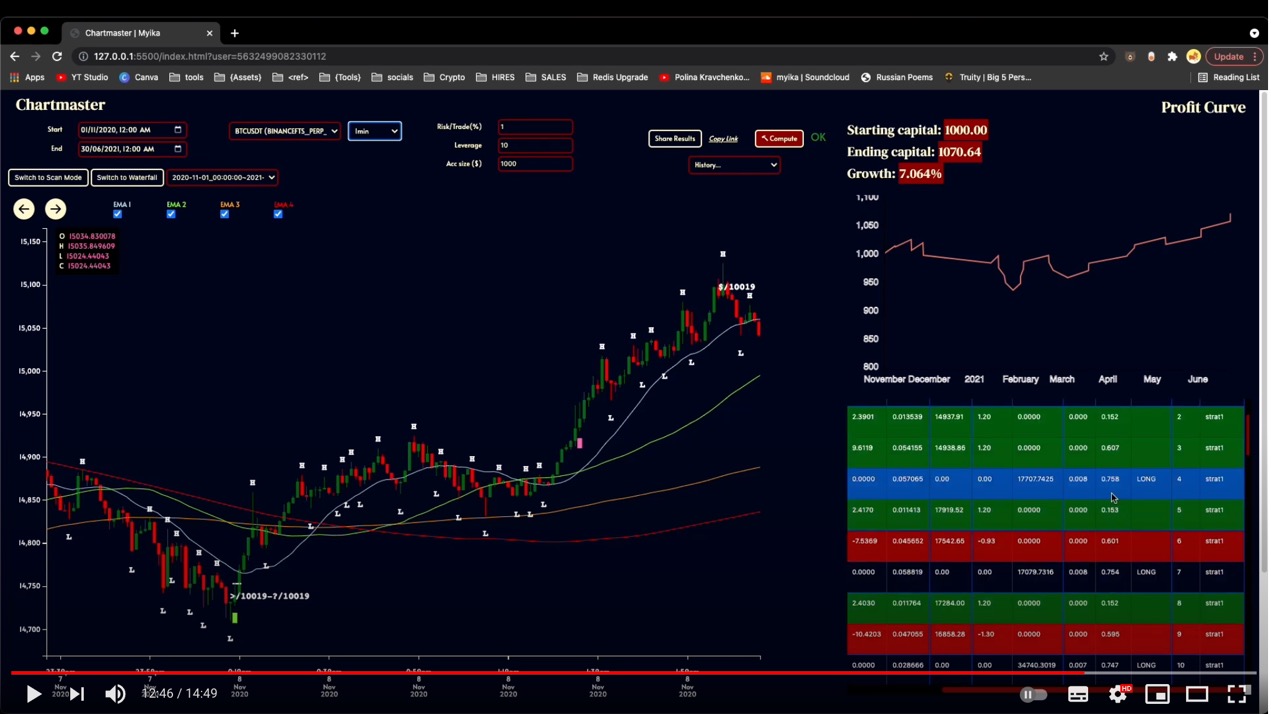
Almost no one knows how trading strategies perform over a long period of time. Because there is no direct, commercially available method to test their effectiveness. Mika used backtracking and repeated testing to try different execution methods, realizing that almost no strategy can work for a long time without interference. That is to say, as long as there is enough time, the strategy will fail.
But some seem to have made good progress over time, and he noticed that these profit strategies all have some common characteristics.
The risk of each transaction is very low
The smaller the percentage of risk you have in each transaction to your account, the more likely the strategy is to be profitable at different times. This makes sense. If every transaction ultimately fails, the smaller your loss, the more likely you are to win at the macro level. I guess this is because the lower the risk percentage of each transaction, the smaller the impact of losses.
But the problem is that your winning rate is not stable. Under certain unpredictable market conditions, there may be a significant decline. If the risk percentage of each transaction is too high, those low periods will leave a big dent in your asset curve. The depth of this dent is enough to hold all your mental burdens, including chronic depression. Even if you start making profits again, these mental pressures are difficult to eliminate.
The ideal risk value varies depending on the strategy. I found that 1% is a good start. In other words, the goal is to only lose 1% of your account's funds in each transaction. Obviously, this will affect the size of your position. When I feel particularly confident, I have actually taken on a 5% risk level.
But please note that a higher percentage of risk can also increase the volatility of your trading curve. The decline will be lower and the peak will also be higher. If its volatility is too high, this strategy poses significant risks when entering and exiting.
Less frequent transactions
Winning strategies often have more options for trading. In fact, it is very selective. I was once shocked to see a one minute strategy that was profitable for 12 months, but in a whole year, there were only 19 transactions.
Super selectivity seems to be a successful strategy. The more you choose settings that are in a wait-and-see state and those that you are not sure about, the more likely you are to increase your loss rate.
In addition, the stationarity of the asset curve is also worth mentioning. Are you willing to earn 5% per month when the profit curve is unstable, or 3% per month when it is relatively stable? I will choose the more stable one. Otherwise, it is difficult to seize the opportunity to open and close positions. On the other hand, stable ones are safer and more predictable.
Many traders cannot bear to wait and see. If they have too much free time, they want to make some transactions. Of course, this is more likely to lead to a bad outcome. You should never enter trading just because you think it's appropriate or because you're bored.
On the contrary, keeping trading to a minimum increases your chances of winning over time.
Understand how your strategy operates
Causality is a trader's nightmare. If you try to find out the reason why things happen in the market, then you will always be searching.
This means that you only know, for example, that when EMA appears in some way, your chances of winning are high. And when they are at a certain moment, the winning rate is very low, which is all about identifying signals. But if you don't know how your strategy wins and loses, you still can't react when you see these signals.
You need to choose what makes your strategy work. Of course, when the short-term Moving Average crosses the long-term moving average, it means that the short-term momentum is changing.
But what is the price trend after the intersection? Is it effective at low volatility? What should I do if there have been intersections recently? How do you detect fake breakthroughs? Do you want to wait for EMA's retest? Or enter immediately after confirming the crossover? Why?
All these questions need to be answered so that you can clearly consider them as real and useful market conditions. In short, find the right environment for your strategy to work. Without this, you are gambling.

EBC Financial Group connects several world-class liquidity quotes to provide customers with true institutional level liquidity and market depth. You can experience high-speed foreign exchange transaction execution and interbank level RAWECN point difference. At the same time, we also remind you to fully understand market risks and Trading Products before trading.
Every serious trader deserves to be taken seriously.


