Pivot points are often dismissed as just another indicator, used and forgotten by many traders after a few inconsistent results. Yet the truth is, pivot points have long been a cornerstone for institutional traders, and they still hold significant value—if you know how to use them correctly.
In this article, we break down the real function of pivot points, uncover how most traders misuse them, and show how they can become a powerful ally in your trading arsenal.
What Are Pivot Points?

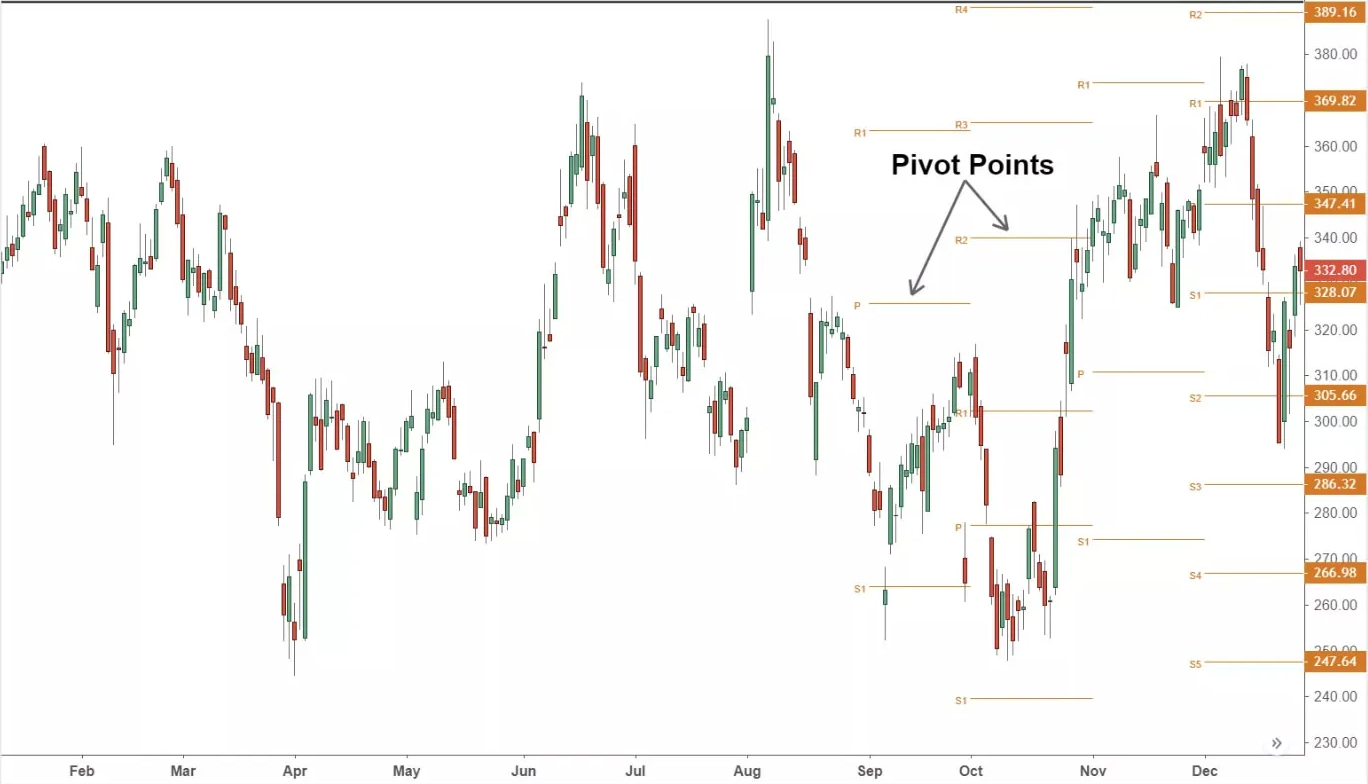
At their core, pivot points are price levels calculated from the previous day's high, low, and closing prices. The central pivot point is the average of these three. From there, additional levels known as support (S1, S2, etc.) and resistance (R1, R2, etc.) are derived. These levels help identify potential turning points in the market.
Pivot points are most commonly used in intraday trading, especially in forex and commodities markets, where price movements are often fast and volatile. They act as a map, guiding traders through the noise of short-term price action.
Why Do Traders Misuse Pivot Points?
Despite their simplicity, pivot points are often misunderstood or misapplied. Here are three common pitfalls:
Over-reliance on automated signals: Many traders plot pivot points on a chart and expect price to react to every level. The reality is that not every pivot level will act as support or resistance on every day.
Ignoring market context: Pivot points work best when paired with volume analysis, trend direction, and other market cues. Blindly buying at S1 or selling at R1 without understanding the bigger picture often leads to poor decisions.
Applying them to the wrong market or timeframe: Pivot points are calculated based on previous session data. Applying daily pivot points to weekly charts or using them in illiquid assets where price doesn't move enough can be ineffective.
The Institutional Edge
While retail traders often use pivot points casually, institutional desks take a more refined approach. They combine pivot levels with other tools like VWAP, order flow, or momentum indicators to form a clearer view of market intention.
A surprising number of professional traders don't care about traditional indicators—except pivot points. Why? Because these levels are often self-fulfilling. Many market participants watch them, so price tends to respect them, at least temporarily. Understanding this dynamic can help you position your trades more strategically.
How to Use Pivot Points the Right Way

To unlock the power of pivot points, traders must shift from viewing them as rigid signals to interpreting them as zones of interest. Here's how to do it:
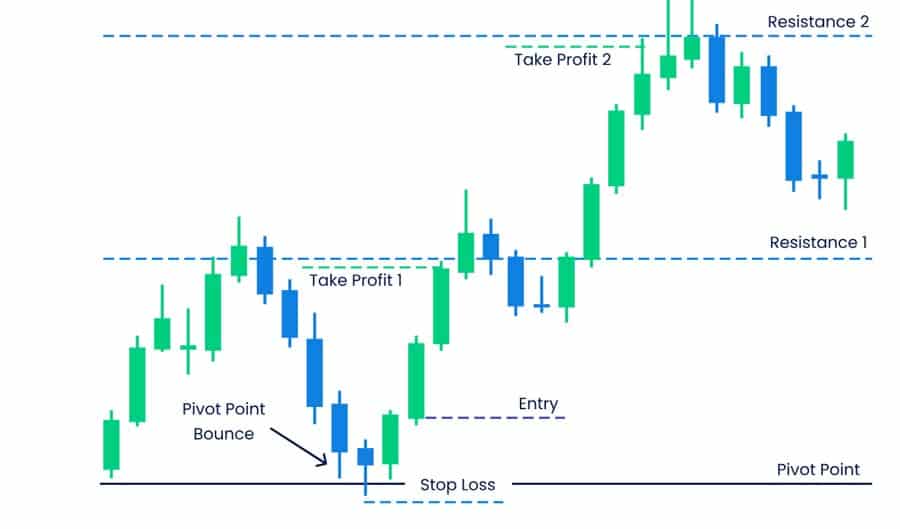
Use pivot points to mark zones, not lines. Price rarely turns on a single level to the pip. Instead, treat areas around the pivot or support/resistance levels as zones of opportunity.
Match pivot points with trend direction. If price is above the central pivot and trending higher, look to buy dips near support levels. If it's below, consider shorting near resistance.
Look for confluence. When pivot levels align with other tools—such as Fibonacci retracements, previous highs/lows, or key moving averages—they gain significance.
Watch volume. A pivot level tested on high volume is more likely to hold or reverse price compared to one tested during a quiet session.
Pivot Points in Today's Market
The usefulness of pivot points is as relevant today as it was 30 years ago. In the era of high-frequency trading, many algorithms incorporate pivot points into their decision-making process. That's why certain price levels consistently act as intraday turning points—they are wired into the logic of many trading systems.
Moreover, pivot points offer clarity in uncertain markets. When fundamentals create volatility, these technical levels can help traders stay objective. In sideways markets, pivot points can also assist in setting realistic targets and stop-loss levels.
Which Type of Pivot Point Should You Use?
There are several pivot point formulas in circulation—standard (classic), Fibonacci, Woodie's, Camarilla, and more. While each has its nuances, the standard formula remains the most widely used and recognised. Here's why:
It's simple and universally understood.
It reflects the pure average of the previous day's activity.
Many platforms default to standard pivot points, increasing their visibility.
However, if you're a more advanced trader, experimenting with alternatives like Fibonacci pivot points can sometimes offer added perspective, especially in trending markets.
Final Thoughts
Pivot points are not magic, nor are they obsolete. They are a time-tested tool that continues to deliver results for traders who know how to read them properly. When integrated into a broader strategy that includes trend analysis, risk management, and volume awareness, pivot points can provide a valuable edge.
Whether you trade forex, commodities and indices, understanding the psychology behind pivot levels can help you anticipate where price may stall, reverse, or accelerate. Don't make the mistake most traders do—using pivot points without context. Master the nuance, and you'll start seeing what many miss.
Disclaimer: This material is for general information purposes only and is not intended as (and should not be considered to be) financial, investment or other advice on which reliance should be placed. No opinion given in the material constitutes a recommendation by EBC or the author that any particular investment, security, transaction or investment strategy is suitable for any specific person.


