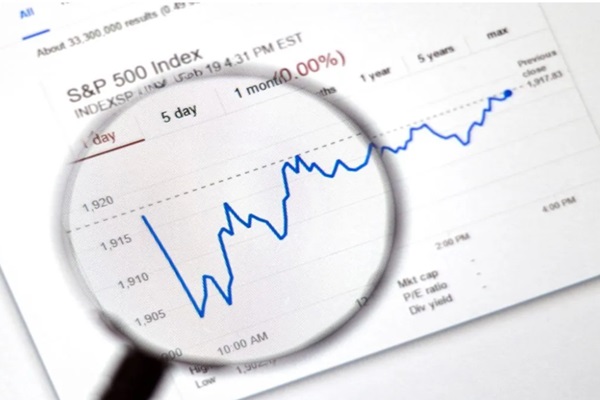
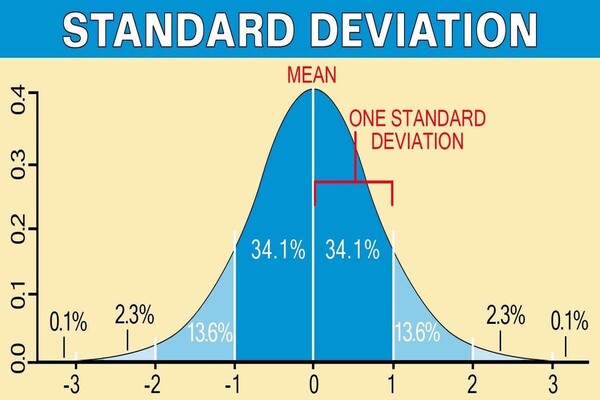
Have you ever wondered how the stock market really works, or how investors track the health of the U.S. economy? If so, you've likely heard of the Standard & Poor's 500(S&P 500)—but what exactly does it represent, and why should you care? Is it a solid investment option, or just another market index to skim over?
For many investors, the Standard & Poor's 500 is more than just a stock market index—it's a gateway to understanding market trends, a tool for assessing economic health, and a reliable foundation for building a diverse, long-term investment strategy.
In this article, we'll take a closer look at the definition, risks and returns of this index, and how it stacks up against other market indices. Whether you're a seasoned investor or just starting out, understanding this index can help you make smarter decisions and get the most out of your investments.
S&P 500's Definition and Importance
The S&P 500 is one of the most widely recognised stock market indices in the world, representing 500 of the largest publicly traded companies in the United States. It includes companies from a diverse range of industries, from technology giants like Apple and Microsoft to consumer staples and healthcare companies like Johnson & Johnson and Procter & Gamble.
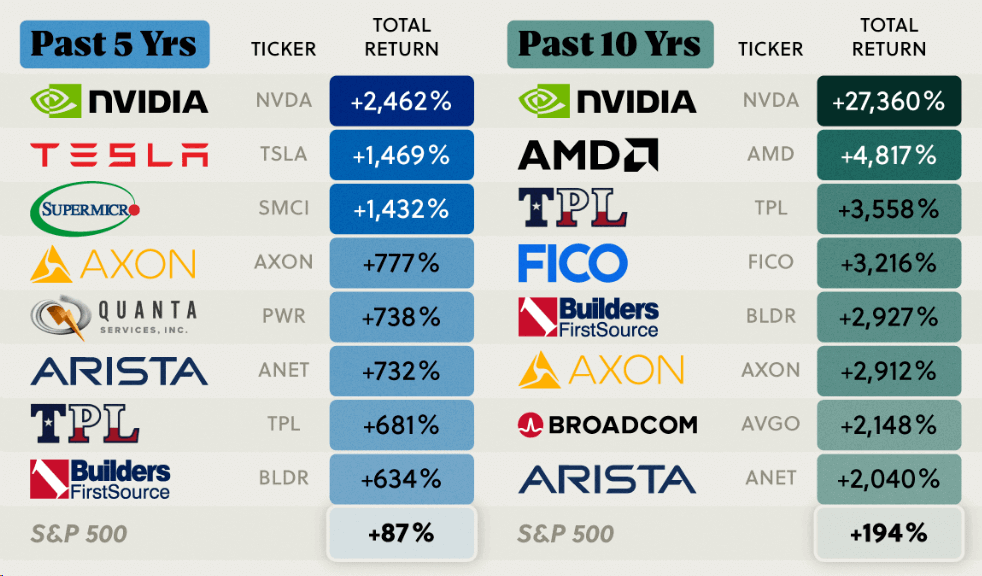
As a market-capitalization-weighted index, it gives more influence to larger companies. This means the performance of this index is heavily influenced by the biggest companies, but it still provides a broad reflection of the U.S. stock market as a whole.
The importance of S&P 500 lies in its role as a benchmark for the U.S. economy and a critical indicator for investors. It serves as a proxy for the overall market's performance and is used by institutional investors, hedge funds, and individual investors to gauge the health of the stock market. This index's performance is often used as a gauge for U.S. economic growth, as it reflects the corporate earnings and business health of major American companies.
For investors, S&P 500 provides an easy way to track the market without having to pick individual stocks. Besides that, it's also one of the most common benchmarks for investment funds and ETFs, making it a central piece of many investment strategies.
S&P 500 Investment's Risks and Returns
When considering an investment in the S&P 500, it's important to weigh the risks against the potential return. While it has delivered strong historical returns, it's not without its ups and downs. So, is the potential for solid returns worth the volatility that often comes with it?
In this section, we'll explore how the potential returns of the S&P 500 compare to its inherent risks, helping you assess whether this index fits into your investment strategy.
Potential Return:
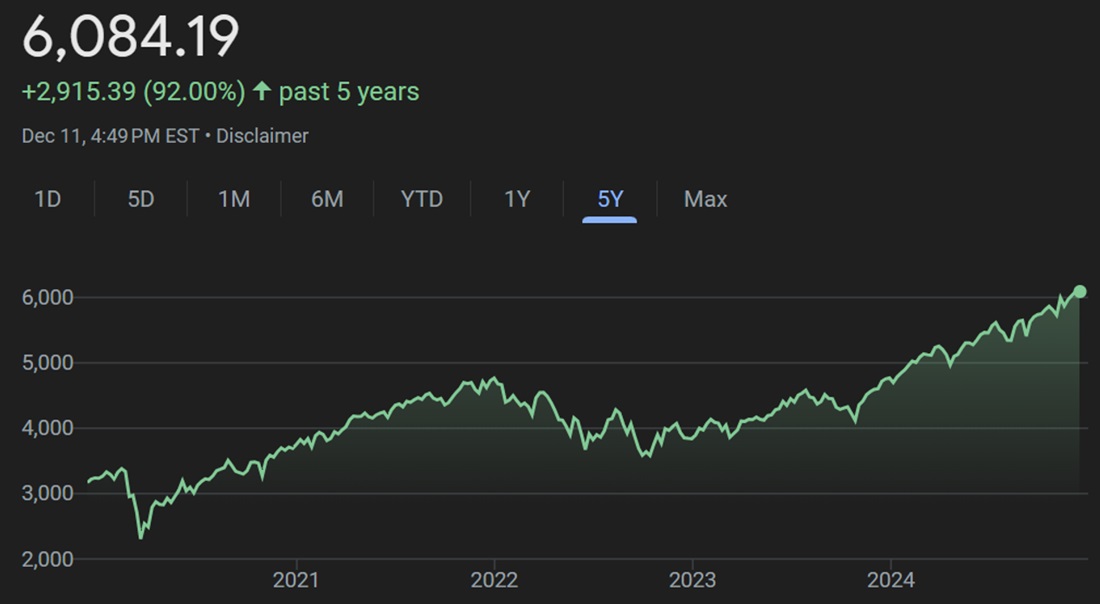
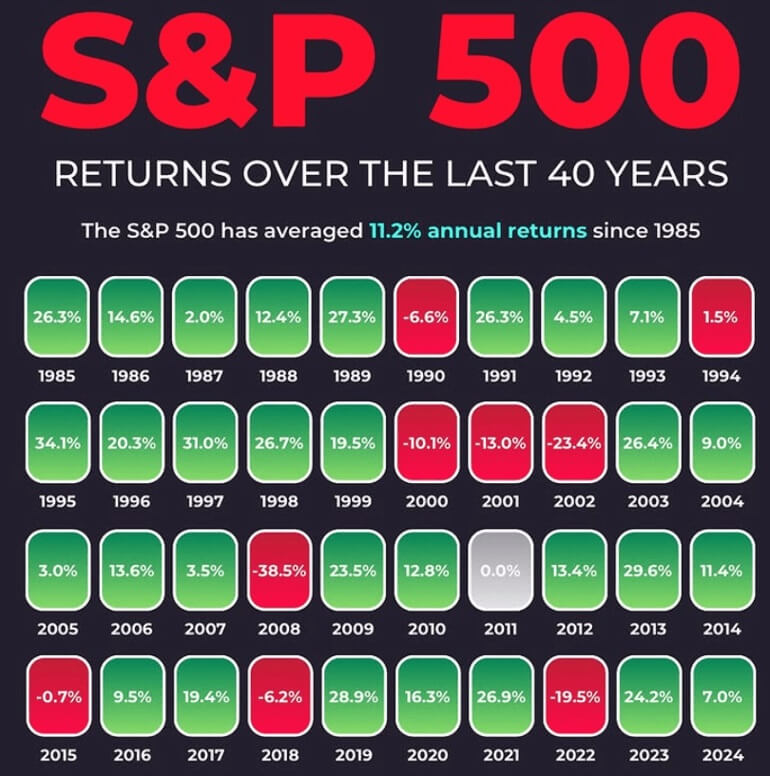
The S&P 500 has historically delivered impressive long-term returns, making it one of the most popular investment vehicles for individual and institutional investors alike. Over the past several decades, the average annual return for it has been around 7% to 10%, after adjusting for inflation. While this return rate varies from year to year, it has demonstrated resilience, particularly over long investment horizons.
The reason for these solid returns lies in the growth of the constituent companies. The S&P 500 is made up of industry-leading companies across sectors like technology, healthcare, consumer goods, and financial services, many of which have shown robust earnings growth. This growth is reflected in the price appreciation of the stocks in the index, which ultimately drives returns for investors.
In addition to price appreciation, this index provides dividends—payments made by companies to shareholders as a share of their profits. Although dividend yields can fluctuate, many of the 500 companies pay out regular dividends, further boosting the total return on investments in the index.
Risks:
While the returns can be attractive, there are significant risks involved with S&P 500 investments. Like any equity-based investment, this index is subject to market volatility. The performance of the index is heavily influenced by broader economic conditions, corporate earnings reports, and investor sentiment.
One of the most notable risks is the potential for large short-term losses. S&P 500 has seen periods of steep declines during financial crises, such as the 2008 global financial crisis and the 2020 COVID-19 market crash, both of which caused the index to lose significant value.
For example, during the 2008 crisis, the S&P 500 lost about 37% of its value, and in 2020. it saw a rapid decline of over 30% before quickly recovering.
The cyclical nature of the stock market also introduces risk. During economic recessions, the S&P 500 tends to suffer declines as consumer spending drops and corporate profits shrink. These downturns can be difficult to predict, and while long-term investors may ride out market fluctuations, the short-term volatility can be unsettling for some.
Another risk is related to the market-cap weighting of the S&P 500. Because the index is weighted by market capitalization, larger companies like Apple, Microsoft, and Amazon have a significant impact on the performance of the index. While this has generally been a positive factor during periods of strong tech performance, it can also be a downside if the larger companies underperform or face difficulties, as their poor performance can drag down the overall index.
Balancing Risk and Return:
Despite the risks, this index remains an appealing option for many investors because of its historical performance. The key to successful investing in the index is understanding that it's a long-term play. In fact, short-term volatility should be expected and even embraced by long-term investors. For those with a long investment horizon, such as retirement savers, the risks associated with market downturns are typically outweighed by the potential for substantial long-term returns.
One of the biggest advantages of investing in the S&P 500 is its diversification. By holding a broad selection of stocks across various sectors, it mitigates the risk that comes with investing in individual companies. This means that even if one company or sector experiences a downturn, the broader index may still perform well, making it a more stable investment compared to holding a smaller number of stocks.
However, it's also important to remember that no investment is risk-free. The S&P 500 is not immune to market downturns, and past performance is no guarantee of future returns. Understanding the balance between potential reward and inherent risk can help investors decide how much exposure to it is appropriate for their portfolio.
S&P 500 vs Other Market Indices
With so many market indices to choose from, how do you know which one is best for tracking the market or shaping your investment strategy? Is this index truly the gold standard, or are there other indices that might offer different advantages? Understanding how it compares to other key market indices can provide valuable insight into where to focus your investments and how to diversify your portfolio.
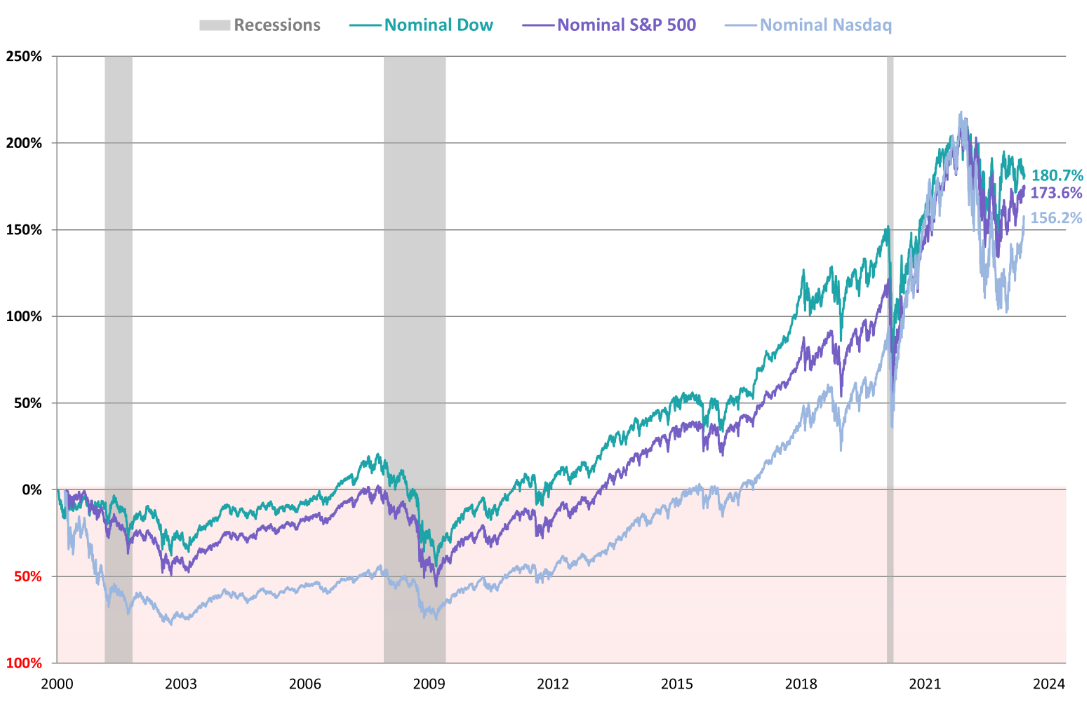
In this section, we'll take a closer look at this index in comparison with two other major indices: the dow jones industrial average and the Nasdaq Composite. By understanding the key differences, you can make more informed decisions about how these indices align with your investment goals.
S&P 500 vs The Dow Jones Industrial Average(DJIA):
The Dow Jones is one of the oldest stock market indices, consisting of only 30 large, blue-chip companies. Unlike the S&P 500. which is market-cap weighted, the Dow is price-weighted—meaning companies with higher Stock Prices have more influence on the index's movement, regardless of their market size.
While the Dow is often seen as a good indicator of the overall U.S. economy, its narrow scope (just 30 companies) means it does not capture the breadth of the U.S. stock market as the S&P 500 does.
S&P 500 vs Nasdaq Composite:
The Nasdaq Composite, on the other hand, is heavily weighted toward technology and growth stocks, including companies like Amazon, Google, and Facebook. It includes more than 3.000 stocks, making it a broader index than the S&P 500. but its focus on tech means it can be more volatile and sensitive to changes in the technology sector.
For investors looking to invest in a more tech-heavy portfolio, the Nasdaq may be appealing, but for those seeking diversification across different sectors, S&P 500 provides a more balanced option.
Choosing between these indices depends on your investment goals and risk tolerance. The S&P 500 is often considered the most balanced and reliable choice for investors seeking exposure to a broad range of sectors and companies. It provides a mix of growth and stability, making it suitable for both long-term investors and those seeking diversification.
In contrast, the Dow's focus on blue-chip stocks may appeal to those interested in stable, high-quality companies. The Nasdaq may be ideal for those seeking exposure to high-growth, tech-driven companies, though it can come with greater volatility.
S&P 500 vs Other Market Indices
| Metric |
S&P 500 |
Dow Jones Industrial Average (DJIA) |
Nasdaq Composite |
| Number of Constituents |
500 companies |
30 companies |
3,000+ companies |
| Market Capitalization |
Market-cap weighted |
Price-weighted |
Market-cap weighted |
| Sector Diversification |
Highly diversified |
Focuses on large-cap stocks |
Tech-heavy (growth stocks) |
| Historical Annual Return |
7%-10% (avg.) |
6%-8% (avg.) |
9%-12% (avg.) |
| Volatility |
Moderate |
Low volatility |
High volatility |
| Risk |
Balanced |
Lower risk |
Higher risk (tech stocks) |
| Best for |
Long-term growth |
Stability and conservative growth |
Growth and tech exposure |
To sum up, the S&P 500 remains a cornerstone for investors seeking broad market exposure with strong historical returns. While it carries risks like any investment, its long-term growth potential makes it a favored choice for diversifying portfolios. Understanding how it compares to other indices like the Dow Jones and Nasdaq can help refine your investment strategy. For many investors, it offers a balanced approach to capturing market performance and building wealth over time.
Disclaimer: This material is for general information purposes only and is not intended as (and should not be considered to be) financial, investment or other advice on which reliance should be placed. No opinion given in the material constitutes a recommendation by EBC or the author that any particular investment, security, transaction or investment strategy is suitable for any specific person.
