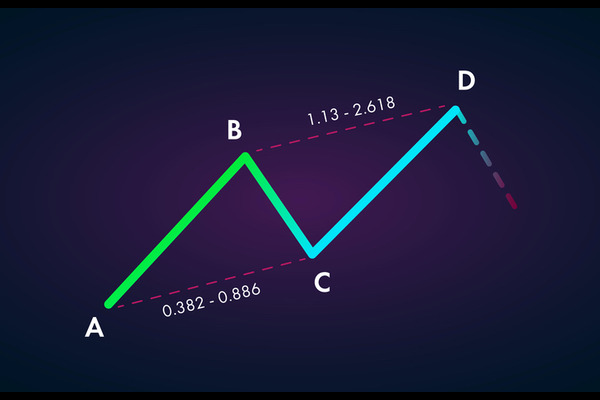
As traders, many people have been looking for systematic and quantifiable methods, such as using indicators, systems, and pre established strategies to decide whether to buy or sell, in order to achieve profitability, but these methods are relatively inefficient. There is a more effective and popular method to find the trend of daytime trading, which is to use order flow trading. The strength of this method lies in the graphical display of the quantity and price data of long and short orders (also known as footprints) in order flow, making the market more transparent.
In this article, EBC Finance will introduce you to the "transaction filter" in order flow trading tools and see how it can improve the accuracy and success rate of transactions.
What is a Trading Filter?
If you want to see how many contracts have been traded, just look at the trading volume. But if you only want to see how much trading volume there is for each contract with a scale of 200 or more? This is where order flow transactions, also known as transaction filters, come into play.
This tool will display transactions exceeding a certain size, which is important because smaller order sizes are small positions of retail investors, while larger orders are truly big players - institutional traders. Transaction filters can display when large-scale funds participate, when they are sold, and when the market rebounds or remains stable.
Simply put, the focus of order flow trading is to understand how institutional orders enter the market and follow market trends by observing the transaction trajectories of large institutional traders.
How to use Trading Filters?
Understanding a tool and knowing how to use it accurately is the key to distinguishing between amateur and professional traders.
Let's start with a test: If the price of a certain asset continues to rise and the daily line is in a very strong upward trend, with a large number of buying orders rapidly emerging within the same time period, should you buy or sell in this market?
The answer should be to sell.
Because once we see a rush of buyers in a market, a sell-off occurs, and the highest quote appears. Those who want to buy have already finished buying, who will be the next buyer to drive the price up? This indicates that buying should stop, but there is no need to short the market immediately. Instead, start searching for other data and find a good entry point for short positions. The reason is that when many people buy something and own it, they are actually sellers waiting to sell it.
Here is an example of a trend rebounding upwards, as a large number of buyers begin to emerge and the market stagnates. The following filter is about SP500 futures (which only shows large-scale orders with a total trading volume exceeding 189 hands), and now we are looking for an opportunity for short trading.
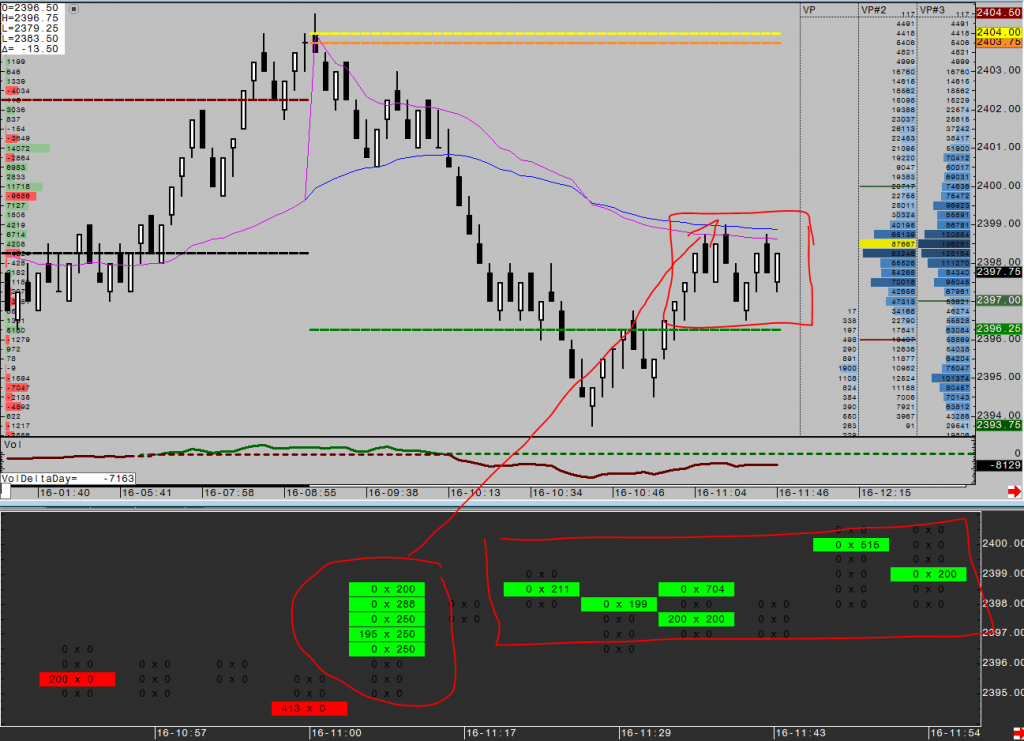
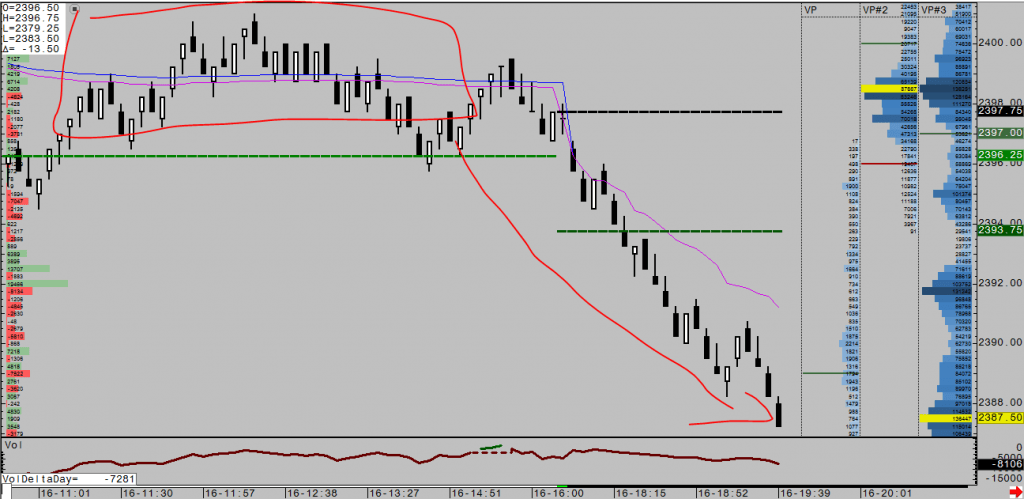
In the afternoon, short trading received a return as the trader's interest in long was depleted. With a large amount of buying displayed on the filter, the trader knew that the buyer was nervous and would start to feel anxious, stopping losses when slightly lower. As the market fell, traders began to sell, fueling more selling, which led to the day's low closing and even continued until the global stock market opened at 6pm Eastern Time in the United States.
Important Parameters in Order Flow Trading
Price
The reason for price fluctuations is often an imbalance between supply and demand. Supply exceeds demand and prices fall; Supply exceeds demand, and prices rise.
Turnover
The trading volume here refers to the number of transactions within a specific time frame. This parameter is closely related to the order flow and can determine whether the supply quantity is low or high. View long and short orders related to price changes, are they moving together or in different directions? If we see an imbalance between supply and demand, it means there are trading opportunities.
Buying/Selling imbalance
Another factor to consider is the imbalance between buying and selling. By checking the orders of other traders and institutions, it can be determined whether buyers or sellers are influencing price changes. By reviewing meaningful real-time orders, we can predict the direction of future orders.
Delta
Delta refers to the difference in trading volume between actively buying and actively selling a certain variety within the k line. Delta can be positive or negative. This parameter value plays a key role in forecasting market price changes. Divergence occurs when there is an imbalance in the direction of price movement. By viewing different long and short orders, you can avoid being trapped by incorrect fluctuations or illusions.
Order Flow Chart Structure
The structure of the order flow chart is easy to understand. The k-line of the chart is also composed of four core elements of high opening and low closing prices, with each row representing a minimum price change (tick). This includes the number of transactions that occurred during that period, as well as multiple short orders (footprints), and calculates the number of active selling (ASK) and active buying (BID) orders. These orders are updated in real-time, providing information on new transactions made at every moment.
Order Flow Trading - Filter Rules
The following are the filtering rules for capturing intraday trading reversals and ongoing transactions:
If a strong upward trend has occurred and you notice a large number of buyers appearing in the filter, then when your strategy is in line, stop buying and start looking for short sellers to enter. If a strong upward trend has occurred and you do not see a large influx of buyers in the filter, do not short the market, consider going long during a pullback or when your strategy allows.
For a strong downward trend with sellers, reverse the above two situations:
If a strong upward trend has occurred, but you suddenly see a large sell order on the filter and maintain a high volatility, you can consider short selling and implementing a sell stop loss to shock out weak bulls.
If a strong downward trend has occurred, but you suddenly see a large number of buy orders on the filter and remain low and volatile, you can consider going long and implementing a buy stop loss to shake out weak bears.
What is the Logic Behind Order Flow Trading?
If we can understand when and where traders make what trading decisions, we can accurately determine which direction the market will move in. The reason is that whenever traders make decisions, such as opening/closing trades, they place orders in the market, which may lead to price changes.
One order alone is not enough to cause price changes, but thousands of orders entering the market at the same time can cause price changes. Therefore, the basic goal of order flow traders is to understand how large fund owners in the market trade, which will enable them to determine when a large number of orders may enter the market and cause prices to rise or fall.
It is quite difficult to find the trading path of other traders because people use many different trading strategies for trading. Fortunately, we don't need to know the details of the trading strategies people use, we only need to know the basic entry positions for their transactions, from which we can determine when and where they make the logic of placing orders in the market.
No one can promise a return rate in trading, and the true secret weapon lies in the trader himself. Success only belongs to those who know how to execute in this process; And a strategy is just a pile of words, it is useless in itself, and the operator of the strategy is the true determinant of success or failure!
Join us and embark on a professional investment experience similar to that of 'Wall Street professional traders'
Learning and utilizing order flow well can help you on the trading path, gain a more thorough understanding of the market, gain insight into the balance of long and short forces between buyers and sellers, truly experience the game of volume price relationship, help you identify the main force, find important support and resistance areas, and enable ordinary investors to have the trading perspective of Wall Street professional traders.
EBC collaborates with the MIFI Micromarket Data Structure Research Institute (Error! Hyperlink reference notValid.) Heavily launching order flow tools, real-time order flow data docking with global exchanges.

The domestic version of MIFI data includes stocks in the Shanghai and Shenzhen stock markets, as well as commodity futures data from various futures commodity exchanges (Shanghai Stock Exchange, Zhengzhou Commodity Exchange), making it suitable for domestic financial investment users.
The international version of EBC data mainly comes from mainstream commodity data from the Chicago Mercantile Exchange (CME), suitable for users who invest in international futures and derivative products.
MIFI will also provide you with a theoretical explanation of trading based on order flow data. The MIFI official website will conduct occasional online video unbinding every week, hoping to inspire you on the trading journey.
EBC always upholds that "every person who deals seriously deserves to be taken seriously"
We hope to bring valuable trading tools and information to you on the investment path through cooperation with excellent institutions. We look forward to your better performance in the trading market.
