Published on: 2023-06-05
Updated on: 2024-08-20

Are you always looking for a professional indicator system or trading system to help you successfully trade?
Do you always have expectations for lasting profits from trading?
But in reality, it may always disappoint you, because in the actual trading practice, there is no indicator or specialized trading system that can guarantee an approximate profit margin, let alone a nearly 100% profit probability.
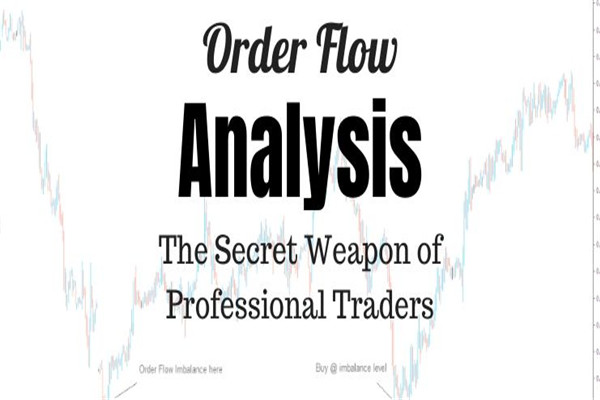
However, there is one exception, many professional traders can achieve a high probability of successful trading with just one tool, which is the "order flow", which is also the most primitive form of data that traders can master. In this article, EBC Finance will talk to you about order flow transactions.
Do transactions need to refer to the "order flow"?
Usually, when seeking trading opportunities in the financial market, there are many analytical methods to choose from. The most popular ones currently include quantitative analysis (mainly based on various mathematical indicators to determine the market), fundamental analysis (based on macroeconomic indicators such as economy, Fiscal Policy, and economic data), key point analysis (based on daily highs and lows, price centers, Fibonacci levels), and so on.
However, none of these commonly used analysis methods can explain why prices stay at a specific price level, and what kind of price trend will change in the next second.
When the price approaches a 'critical point', different expected situations will occur: the price may reverse, may quickly reverse and break through the level, may directly break through the level, or may falsely break through.
The analysis of "order flow" provides a meaningful definition of "key points", which depend on how strongly they are supported by order transaction volume at that price level.
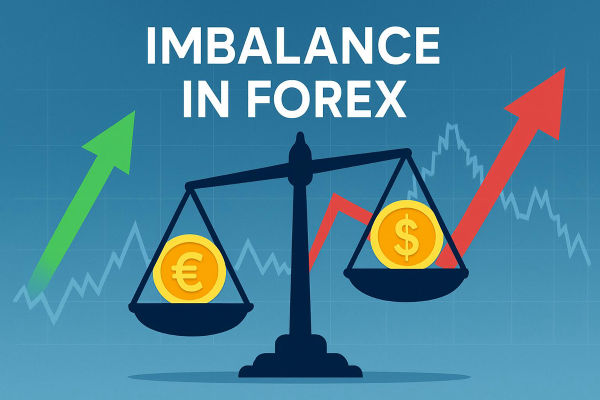
The market is driven by "supply" and "demand", "buyers" and "sellers". If one party surpasses the other, then that party has an advantage in the market.

2. What is "order flow"?
The order flow defines the number of orders waiting to be executed at a certain price level.
When the price rises in a very strong rebound, we can be certain that it will eventually stop somewhere.
The reason why an upward trend occurs is because there are more traders willing to buy than those willing to sell, which creates an imbalance between buyers and sellers. When more buyers demand to buy, the price will shift upwards.
In the end, the buyer's momentum ends, and prices are pushed up to a level where there are more sellers than buyers. The trend changes, and the new imbalance caused by more sellers than buyers will drive prices downward.
This simple scenario is what has been happening in the market at both macro and micro levels, which is also the essence of causing price movements or reversals.
When you see a price trend chart, you can understand it as a long short power game and balance at each different price level. This is a perspective from which to view the price trends that have already occurred.
If you can predict the upcoming price point from a relatively accurate perspective in advance, and if you know in advance that the order flow may cause price changes at a certain time in the future, do you have the advantage of trading?
If you can be certain, you can know exactly where to enter and exit the transaction.
Order flow analysis is a unique trading analysis concept that can help you predict where order imbalances will occur at future price levels, allowing you to more confidently determine where to enter the market more appropriately.
Investors can view the order flow as a relationship between tradersThe ability to obtain sufficient information from the opponent in a "chess game" is crucial for maintaining a leading position. If you know what your opponent is doing, then you can make appropriate responses.

3. Overview of "Order Flow" Transactions
Let's take a look at a few small trading cases.
Limited price order
Firstly, there are price limit orders, which is where the Market Depth Map (DOM) comes into play. Limited price orders can be considered inventory orders on DOM. Based on the content provided by the order flow tool, you can even see the complete commissioned order situation, which means the depth of the entire market. This is a powerful tool, and if you can see the location of large orders, you will know at which point in the limited price order, the price that hides huge profits is located. And the footprint map is a combination of market depth map and K-line map, through which you can see the situation of buying and selling orders within a single K-line.
The following figure is a 5-point reversal footprint map of ES futures, which represents the trading volume of each K-line. You can see how many bids (buyers) and asking prices (sellers) have been traded on each scale.

You can see the blue and red rectangles at the bottom and top of the picture. The red rectangle represents the quotation limit (seller), while the blue rectangle represents the bidding limit (buyer). They are filtered, so only a portion of the order quantities from DOM are displayed on the chart.
These limit orders are only triggered for trading when the price reaches the corresponding price, and a large number of limit orders are concentrated at attractive price levels, but there is no guarantee that these prices can be reached and traded. In this case, these limited price orders will serve as support and resistance in the trading market, which is where the number of orders on the footprint map serves as a reference for trading.
The change of the Price ceiling and floor in the price Limit Order, that is, the limit value goes up or down, means that the buying or selling party becomes radical, which will move the market transaction price to the direction of the radical.
The following figure is an example:

At the top of the 2744-45 area of ES (red rectangle), there is a messy quotation area (seller). As prices move, sellers begin to aggressively lower prices, while at the same time, bid limits (blue rectangles) are being broken and these limit orders are starting to be closed, a process reflected in the footprint map.
In this example, it indicates that sellers are increasingly recognizing the downward trend and have made some withdrawals in their trading order behavior, hoping to sell a large number of positions to gain profits when prices fall.
2. Market orders
Market orders can be divided into two categories. One is the price limit order that has just been closed, and the other is the order that enters the market at the current market price. These orders drive the price, which is reflected in the footprint map and can be seen in the K line.
Each K-line is equipped with a certain number of transactions, some of which are more than others, and larger K-lines have more transaction volume than smaller ones. What is more important than the size of the K line is the content contained within it.
A key area to focus on is the trading volume (indicated by a white border) on a single scale node on the K-line. Additionally, it should be noted that the highlighted red or green numbers represent the imbalance between selling and buying, respectively.
The following figure is an example:

In the center of the image, we see a combination of price limits and market order flow.
At the top, there are aggressive quotes entering the market, driving down prices.
At the same time, active buying was stifled by the seller. This can be seen behind the large green K line on the left side of the image. A small green K-line forms a high volume node (circled by a white border), and there is a selling imbalance at that node. Accompanied by a large number of selling quotes at this tick mark level. In the next K-line, the buyer attempted to push the price up to a higher tick point, but they were stopped by aggressive sellers in the subsequent K-line, resulting in the final price falling.
Epilogue
Trading through order flow can be carried out in various ways. This article only shows you some of the process of using order flow tools to assist in trading, hoping to give you some inspiration.
In the field of investment trading, regardless of the method or tool used, traders must learn to use tools to quickly receive information when it enters the market, interpret it through rigorous logical reasoning, understand and understand the ever-changing trading and game information in the market, gain insight into the operational trends of other traders, and provide reference and assistance for their own trading.
EBC always adheres to the principle that "every person who deals seriously deserves to be taken seriously", and hopes to bring valuable trading tools and information to you on the investment path through cooperation with excellent institutions. We look forward to your better performance in the trading market