I believe most traders have heard of the "Kelly formula". If there is a certain amount of money, analyzing the appropriate investment position for a particular investment, the first thing we think of is the Kelly formula.
This formula was first proposed by John Kelly, a scientist at Bell Laboratories, in 1956. It can be used to calculate the optimal ratio of a fund investment to maximize the expected logarithm (i.e. geometric growth rate) of wealth growth.
Although the Kelly formula is often mentioned in the gambling and financial industries, people's understanding of it is limited. It should be noted that if there is insufficient understanding of it, leading to the misuse of formulas, it can cause huge losses to the wealth of investment traders. In this article, EBC Finance takes you to a deep science popularization of the "Kelly Formula".
We often face two basic problems when investing and trading in our daily lives:
1. How to find investment opportunities with positive expected returns at maturity?
2. How to determine the proportion of your investment/bet?
Most professional traders believe that the second of the two questions is more difficult, such as: a blackjack player deciding the proportion to bet on a certain hand, a real estate investor deciding how much money to invest in her investment portfolio in the real estate sector, and a derivative trader deciding how much leverage to use in a new strategy.
For most investors, finding investment opportunities is relatively easy compared to position size and risk management.
Someone once said that a relatively mediocre strategy, with a great risk control model, will also become quite successful; And a great strategy, if the risk control model is mediocre, will also become very unsuccessful. It can be seen that a scientific position matching/risk control model is important for investment trading.
A Simple Example:
The Kelly formula is commonly used in investment scenarios where the probability of loss and victory is known, and the expected return is positive; If the expected return on an investment is negative, Kelly's advice is not to bet.
For example, a card counter who plays blackjack knows the current "run count" and "true count", that is, the probability of winning/losing the next hand is 52% to 48%. A 52% chance to win is certainly very attractive, but what gamblers would prefer to know is how much capital ratio should they bet on in their next hand?
He must strike a balance between the two forces of 'betting more to gain greater profits' and' betting less to reduce the risk of loss and bankruptcy '.
The Kelly formula tells us that there is an optimal ratio of net asset investment between these two demand forces, thereby maximizing long-term wealth.
We can conduct empirical experiments with different bet sizes to see how net assets change over time. Let's first assume that the gambler bets 1% of their net assets on each hand. Below is a chart of the changes in their net assets during the 1000 hand simulation process:
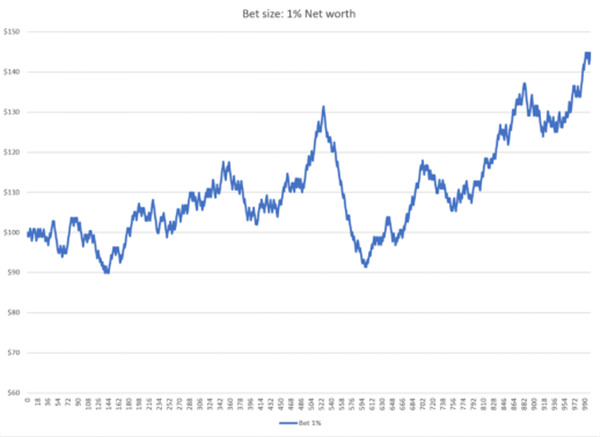
It can be seen that this strategy of betting 1% each time will have good returns over time, but there is also some volatility. After 1000 hands, the gambler's wealth increased by 44%.
What if gamblers place a larger investment ratio (i.e. net asset ratio) on each bet? The following chart shows the long-term net asset changes under the scale of bets of 1%, 2%, and 4% of his net assets invested in each hand:
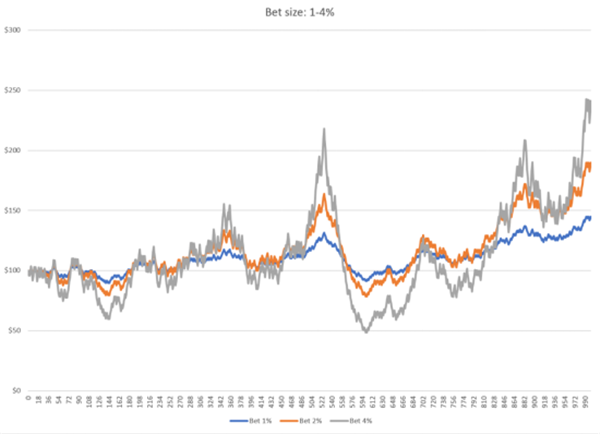
It can be clearly seen that as the proportion of bets increases, the volatility of profits and net assets also increases in the same direction.
We continue to test larger bet sizes:
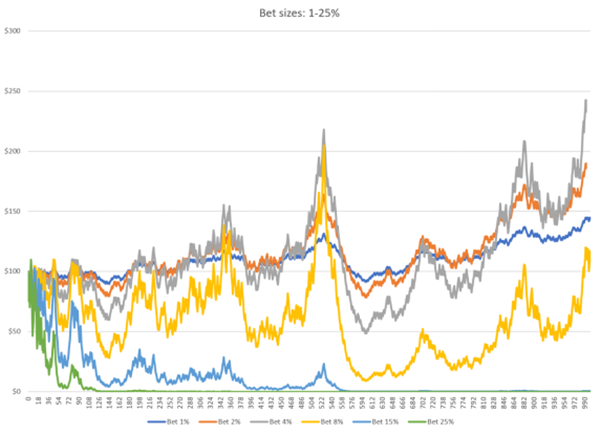
Some unexpected simulation results have emerged:
Although our cumulative profit steadily increases as our bet size increases from 1% to 4%, we see that with an 8% bet ratio, the returns are noticeably worse, with a 15% and 25% bet ratio, even resulting in the gambler's final net asset being zero, i.e. losing all funds.
We conclude that as the betting ratio increases, the volatility of net asset changes will continue to increase, but its profits will reverse after reaching a peak. So, blindly investing in large proportions can have a reverse destructive effect on wealth.
This simulation result provides a derivative thinking: why would investing more in situations where there is a profit opportunity actually lead to worse long-term results?
Mathematical Validation
We use a new example to explore that in a new investment project, there is a 50/50 chance of gain or loss (i.e. a 50% win rate), with a 6% gain and only a 5% loss. You can choose to increase or decrease your bet as you wish (i.e., use leverage) until there is a possibility of complete loss.
Previously, we used 1000 consecutive bets as an example of long-term wealth creation. Now, we will simplify this example to two consecutive bets, one winning and one losing. Because in the long run, the winning/losing ratio experienced will approach an average winning/losing ratio of 50/50. Furthermore, because we are looking at the compound growth of investment, the order of results is not important. Therefore, considering two bets with opposite results can reasonably estimate the geometric growth rate of investment.
The following is the profit situation after experiencing a win (+6%) and a loss (-5%) with an initial capital of $100 and different betting ratios (leverage):
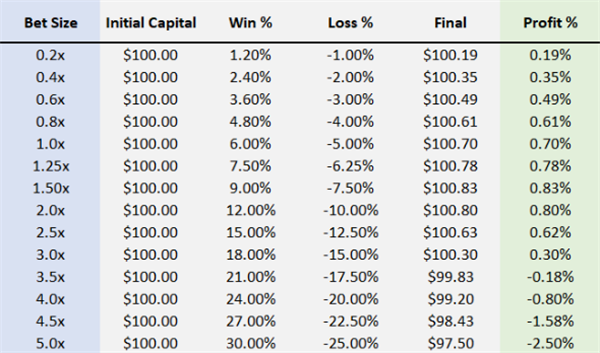
It can be seen that in small-scale bets, profits increase with the increase of leverage ratio, which is almost a one-to-one relationship. But as leverage increases, profits shrink and eventually become negative. A profit of twice the leverage is lower than a profit of 1.5 times the leverage. A leverage ratio ratio greater than three times is actually a loss making strategy.
This introduces a new concept - NGD (Negative Geometry)Drag), which represents the net loss value caused by X% loss (or loss before profit) after obtaining X% profit. For example, if you lose 10% on an investment and then earn 10% (investment × zero point nine zero × 1.10), you have reduced your initial investment by 1%; If you first lose 20% and then earn 20%, you will be reduced by 4% from the beginning.
Here is an investment project with a 50% win rate and an equal win and loss ratio. Let's take a look at the changes in NGD under different betting ratios (i.e. leverage):

It can be seen that the growth rate of NGD is the square of the growth rate of leverage.
Now we can have a more complete understanding of how leverage affects profits, namely:
When leverage increases, the marginal profit of net asset growth increases linearly with the increase of leverage, but in the scenario of multiple bets, NGD shows a square growth with the increase of leverage.
At lower levels of leverage, marginal profit is the dominant force, and NGD can be ignored. However, with the growth of leverage ratio, NGD has become larger, and ultimately overwhelmed our margin.
Next, let's return to the investment project with a 50% winning rate, 6% return/5% loss. Under different levels of leverage, the changes in marginal profit, NGD, and final profit:
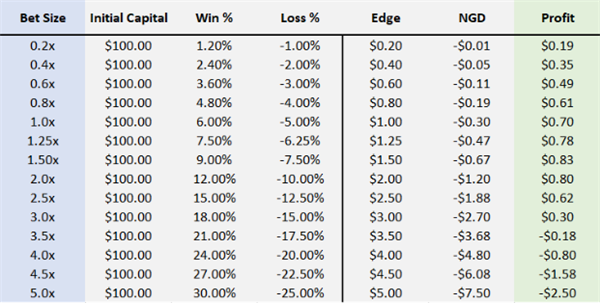
Marginal profit+NGD=Final profit
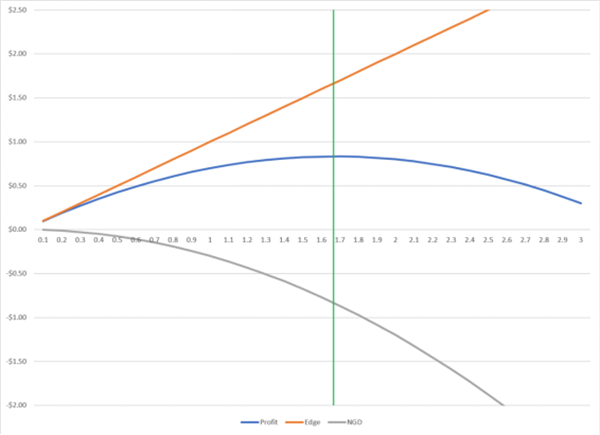
As shown in the above figure, the green vertical line represents the point where the two opposing forces of marginal profit and NGD completely cancel out each other (marginal profit=NGD), which is the maximum profit point (leverage 1.66 times). Any additional leverage will lead to a decrease in profit.
In other words, using this level of leverage will maximize the geometric growth rate of your wealth through multiple bets, investments, or trading processes.
Taking the example of BlackJack, conducting this experiment in 1000 bets would result in a 1.66 fold leverage that would turn $100 into approximately $6340. Three times the leverage can only return $447, while four times the reckless leverage will grind the original $100 to less than $2.
Kelly formula
After exploring the positive and negative effects of the aforementioned leverage, we will discuss the Kelly formula.
The Kelly formula aims to calculate the proportion of net assets that can be invested each time, given the winning rate and expected profit and loss, in order to achieve the maximum growth rate of wealth.
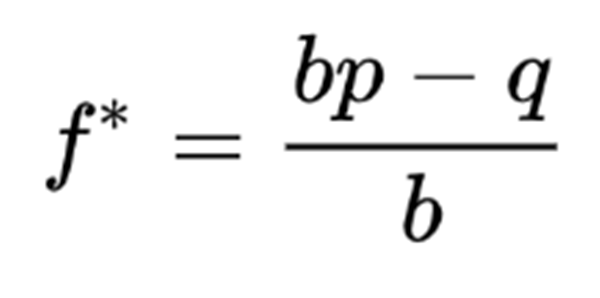
The left side of the above equation, f *, is the percentage of total wealth that we should invest in risk.
On the right-hand side, p is the probability of winning, q=1-p is the probability of losing, and b is the odds (i.e. the ratio of the amount we win to the amount we lose). For example, if we either win $2 or lose $1, our odds are 2:1, and we set b to 2.
Applying Kelly to our investment example:
P=50%, q=50%, b=1.2
In this case, we set b=1.2 to indicate that the reward for winning (6%) is 1.2 times the penalty for losing (-5%). Then we can fill these values into the formula:

According to Kelly's formula, the optimal bet option is 8.33% of total wealth. Since the basic loss in our example is 5%, this means that we should use a lever of 8.33%/5%=1.66. This is exactly the value we discovered earlier.
Let's take the example of blackjack again. Players have a 52% chance of winning (p) and a 48% chance of losing (q), with a flat probability (b=1).
According to Kelly's formula, 4% of its assets should be invested.
Looking back at the chart above, we can see that Kelly's formula correctly calculates the optimal bet for two scenarios.
Next, EBC Finance will further introduce the Kelly curve to everyone.
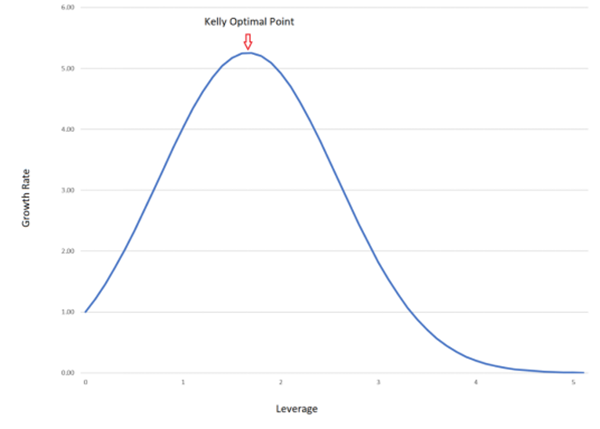
In the above figure, the Y-axis represents the geometric growth rate, the X-axis represents the leverage ratio ratio, and Kelly's best bet is at the highest point of the curve. In fact, in many practical applications in many fields, the forms displayed by charts are generally similar.
The main application scenario of Kelly's formula is to calculate the proportion of funds that should be invested in order to achieve maximum asset growth, given the known winning rate and known return (i.e. loss).
However, it should be noted that the Kelly formula cannot be used to calculate the probability of winning an investment and the return on profit or loss.
The Kelly formula represents the limit of the rational betting range, and any bet that is one penny higher than the conclusion drawn by the Kelly formula will bring about an increase in risk, meaning that while the variance increases, profits decrease.
However, in most cases, when the betting volume approaches the Kelly optimal point, the steepness of the Kelly curve will slow down, meaning that the ratio of additional risk to additional profit will reach infinity, indicating that investors may take an additional $1 billion in risk to earn an extra penny of expected profit.
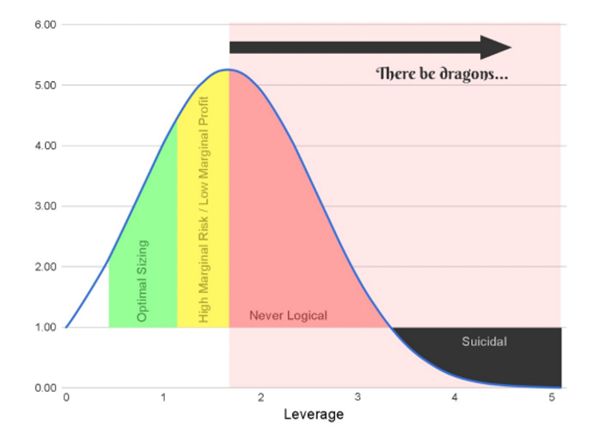
Based on the above figure, the green area is a relatively preferred opening ratio, especially for risk averse investment traders.
Theory and Practice
In theory, there is no difference between theory and practice. However, in practical practice, there is
In order to utilize the Kelly formula in practical applications, two modifications are proposed here:
1. The assumptions about the proposed investment project should be as conservative as possible, selecting the worst-case scenario (winning ratio, loss ratio) from various possible scenarios, and placing rigorous insurance on your investment estimate before calculating the bet using the Kelly formula.
2. Set a discount factor (which can be 0.3 or 0.5 times) for the position ratio calculated by Kelly's formula.
The first amendment takes into account that the profit probability and probability used in the formula are only estimates. The true probability and return are hidden, and in all likelihood, the actual profit will be less than what we estimate. When investing in an uncertain world, conservative assumptions are closer to reality than expected. This is the so-called 'margin of safety'.
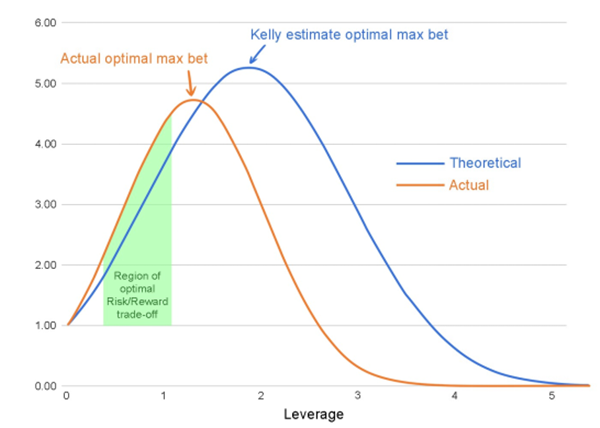
The second amendment comes from the following observation conclusion:
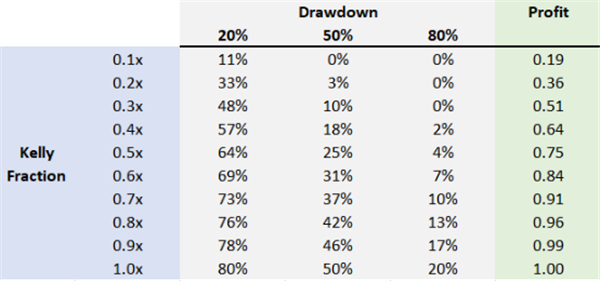
Compared to the positions calculated by the Kelly formula, multiplied by the discount coefficient, volatility risk (variance) can be reduced to a certain extent, and the corresponding expected return reduction is smaller than the variance, as shown in the table above. Therefore, betting at 0.3 or 0.5 times the size of the Kelly position can preserve a disproportionate expected profit. Specifically
Placing a 50% stake in Kelly's position ratio yields 75% of Kelly's best profit, but only bears 1/4 of the variance (volatility risk).
Placing a 30% stake in Kelly's position ratio yields 51% of Kelly's best profit, but only assumes a variance of 1/9 (volatility risk).
For general individual investors, a 30% Kelly position ratio is very reasonable and acceptable; For professional investors or investors engaged in customer wealth management fund management business, the optimal risk management/position level is even lower, especially in situations where downstream customer demand is changing. For fund managers, how to maintain stability in investment transactions is the primary rule, and the discount coefficient generally chosen is 0.1-0.15 times that of Kelly positions.
The Kelly formula has a very wide range of applications in investment trading. Its core is to control risks and, on this basis, achieve maximum returns. It is a representative of human rational trading. Finally, summarize the essence of Kelly's formula:
1. When the expected return of an investment project is positive, Kelly's formula can calculate the proportion of bets that increase assets the fastest while traders are not bankrupt.
2. Stop betting when the expected return on an investment project is zero or negative.
3. When the expected returns are the same, increasing the winning or losing ratio of the trading system can correspondingly increase the maximum position, thereby increasing the asset growth rate.
4. When the Kelly formula is applied to various investment transactions, due to different market conditions, the overly aggressive Kelly formula cannot be used to calculate positions. Instead, a certain discount coefficient can be set to reduce trading risks.


