2023-06-05
What is order flow? This was once rated as the most popular trading method by Futures magazine in 2019 and the most popular trading tool for Wall Street hedge funds. It has been listed on the overseas Futures website and NinjaWho is it that the ecosystem development community has become a popular trading technology on top 1? This article will take you to explore the truth.

What is "order flow"
Order Flow Trading, as an important branch of market micro data structure, is currently an essential trading tool for professional institutions in Europe and America. It mainly adds a new "real-time buying and selling order volume" as a reference for three-dimensional trading data on the basis of traditional two-dimensional trading data (time, price). Through it, it can more scientifically and intuitively understand the movements of major funds, and then analyze the market long short power game, Identify individual investors and the composition of major investors, determine the position of major funding chips, and identify trends in fundraising and fundraising.
Different from the traditional two-dimensional trading data of time and price, the order flow data focuses more on "understanding the trading behavior of other market participants", allowing investors to view the market from a higher and more objective point of view, but also closer to the market and deeper observation, so that ordinary traders can also have a trading perspective of main funds, timely capture market sentiment, and empower their own trading.
The logic behind order flow transactions
Someone once said that trading directly with the amount of funds in the market can naturally generate extremely significant trading returns, but often such information is only available to a few people.
The order flow tool provides a new perspective on market orders and capital levels.
If you can know when and where traders in the market may make trading decisions, you can relatively accurately determine which direction the market will move.
The reason is that every time a trader makes a decision, such as opening or closing a position, it may cause a price change.
One order alone is not enough to cause a price change, but thousands of orders entering the market at the same time are enough to cause a price change. Therefore, the fundamental idea of order flow traders is to understand how large funds in the market are traded, which will enable them to determine when a large number of orders may enter the market and cause prices to rise or fall.
It is very difficult to find the trading path of other traders, as people use many different dimensions of trading strategies. Fortunately, we do not need to know what trading strategies traders are using, but rather need to be result oriented, understand their basic entry positions, and the order volume placed, which is enough to provide valuable reference for our trading.
Order Flow Trading "Analysis Tool"
The essence of order flow trading is to react based on market behavior, which is determined by the daily trading volume.
When you see a price trend chart, it can be understood as "the game and balance of long and short forces at each different price level, while order flow defines the number of orders waiting to be executed at a certain price level.
Order flow analysis, as a unique trading analysis concept, can help you predict where the imbalance in order volume between buyers and sellers will occur in future price trends. This can help you more confidently determine where to enter the market more appropriately. In other words, through order flow analysis, traders can gain insight into the trading behavior of other market participants and provide reference for their own trading.
Order flow analysis includes several major tools, including footprint maps, cumulative difference maps, and market depth maps, which are currently popular.
Footprint:

Compared to traditional K-line chart transactions, footprint charts can see individual transactions within a single K-line and present them to users in a visual manner.
The numbers at both ends of each K line represent the number of "buy orders" and "sell orders" at a certain price point, which can also be understood as a simplified market depth map:
When there are much more buying orders than selling orders, it indicates that the price level is a potential support level;
When there are significantly more selling orders than buying orders, it indicates that the price level is a potential resistance level.
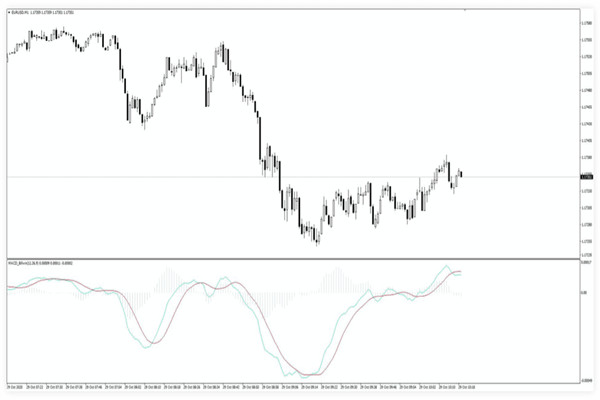
Accumulated Difference Chart:

As shown in the above figure, the upper half of the chart is marked with a K line, and the red box in the lower half is the cumulative chart with each difference. The two figures above show two different forms of cumulative chart with each difference.
The cumulative difference chart mainly represents the Delta net value (=active buying volume - active selling volume):
If the market is dominated by bulls, Delta is usually positive;
If the market is dominated by bears, Delta is negative.
If the price continues to reach new lows but the strength of delta does not reach new lows, it can be seen as a deviation.
Order flow 'instance unwinding'

Taking the gold market on May 18, 2022 (daily chart) as an example, we can use the POC main funds theory in the order flow to conduct simple transactions:
Poc represents the price level at which the sum of active buying and active selling orders (total transaction volume) within a k-line is the highest. The price of Poc in the figure above is 1810.8. At this time, it can be seen that the total transaction volume on May 18th was 108631 lots, with Delta=1775, indicating that the k-line is fully indicative of interpretation (not much lower than the previous value). The lowest price of the day was 1804.9, with a POC of 1810.8 and a closing price of 1815, indicating that market participants were no longer able to bring the price to a lower level. This was because the main funds were constantly raising funds in the price range of 1807.9-1815, attempting to bring the price to a higher level. We can set the entry price near the closing price of 1815 on the 18th on the opening day of the 19th, with a stop loss of 100 pips. The price has been rising all the way since the 19th, The maximum price has retreated to 1808 (70pips), and while the poc pattern does not reverse, the position remains open. As of the 23rd, the maximum price has reached 1860, where there is already a profit margin of 450pips and an expected profit to loss ratio of 4.5:1.
Join us and embark on a professional investment experience similar to that of 'Wall Street professional traders'
Learning and utilizing order flow well can help you on the trading path, gain a more thorough understanding of the market, gain insight into the balance of long and short forces between buyers and sellers, truly experience the game of volume price relationship, help you identify the main force, find important support and resistance areas, and enable ordinary investors to have the trading perspective of Wall Street professional traders.
Starting from today, EBC, in collaboration with the MIFI Institute for Micro Market Data Structure (www.mifipedia. com), launched a massive order flow tool to connect real-time order flow data to global exchange markets.

The domestic version of MIFI data includes stocks in the Shanghai and Shenzhen stock markets, as well as commodity futures data from various futures commodity exchanges (Shanghai Stock Exchange, Zhengzhou Commodity Exchange), making it suitable for domestic financial investment users.
The international version of EBC data mainly comes from mainstream commodity data from the Chicago Mercantile Exchange (CME), suitable for users who invest in international futures and derivative products.

MIFI will also provide you with a theoretical explanation of trading based on order flow data. The MIFI official website will conduct occasional online video unbinding every week, hoping to inspire you on the trading journey.
EBC always upholds that 'every person who deals seriously deserves to be taken seriously'
We hope to bring valuable trading tools and information to you on the investment path through cooperation with excellent institutions. We look forward to your better performance in the trading market.