Investing in the financial markets carries a high level of risk and can lead to losses, so it's crucial to pay attention to fundamentals and market dynamics. The non-farm payroll data released by the United States every month may seem to be just an ordinary economic indicator, but its release can instantly trigger violent fluctuations in the global financial markets. Therefore, many investors will pay close attention to its release time in order to grasp the market trend according to the data. Next, let's learn about the Non-Farm Payrolls data release schedule for 2024 and share some key tips for interpreting it.

Non-farm payroll data concept and sources
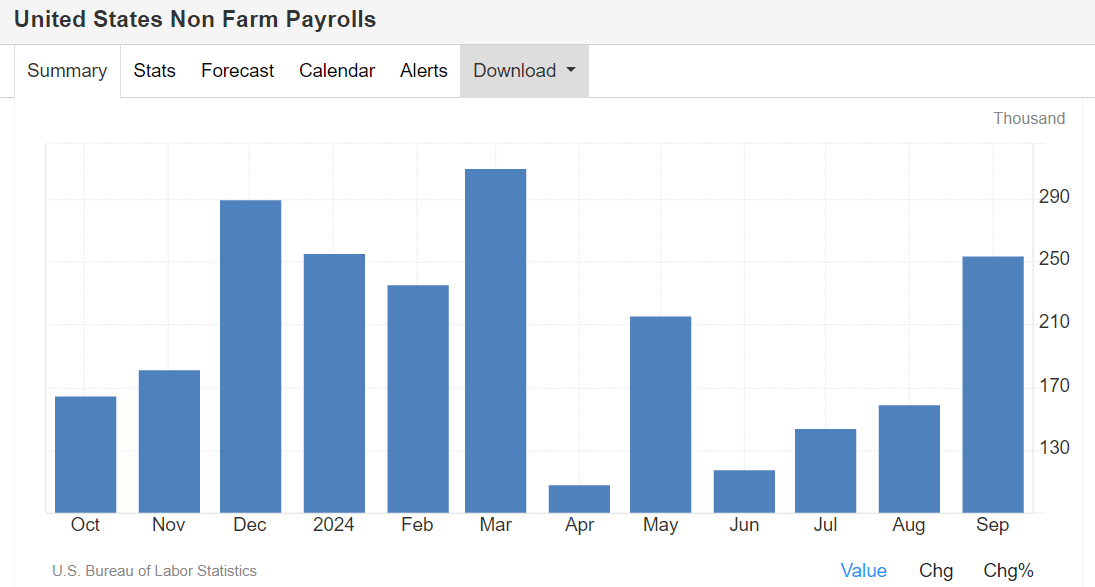
Non-Farm Payrolls (NFP), or Non-Farm Payrolls Report. It is an important economic indicator released monthly by the U.S. Department of Labor, reflecting the employment situation in the non-agricultural sector of the U.S. economy. The report counts the number of new jobs created in all industries except the agricultural sector, covering a wide range of areas such as manufacturing, services, and construction.
Non-farm payroll data is an important indicator of the health of the U.S. economy, reflecting the activity of the labor market and overall economic conditions. Typically, a higher number of new jobs is indicative of strong economic growth, positive business performance in terms of expansion, investment, and hiring, and increased consumer confidence. Together, these factors contribute to a virtuous cycle in the economy.
On the contrary, a lower-than-expected number of new jobs could suggest a slowdown in the economy, businesses becoming cautious in hiring and expansion, unemployment could rise, and consumer spending could suffer. These signs not only affect investor confidence in the market but may also lead to a reassessment of monetary policy by the Federal Reserve, further affecting financial market volatility.
Non-farm payroll data are collected, collated, and released by the Bureau of Labor Statistics (BLS) under the U.S. Department of Labor, which employs a rigorous statistical methodology to ensure the accuracy and reliability of the data through both business surveys and household surveys. These data provide a solid foundation for analyzing the health of the US labor market and are an important reference for the government in formulating economic policies, as well as a key indicator for market analysis.
Firstly, the Enterprise Survey (ESS) collects key information such as employment numbers, wage levels, and working hours through a sample of about 140.000 businesses and government agencies. The survey captures changes in employment across industries and provides direct firm-level data to help analyze the dynamics of economic activity. The survey is particularly useful for analyzing industry trends and changes in labor demand.
Second, the Household Survey (HHS) is mainly used to obtain data on unemployment and labor force participation rates through a sample of about 60 000 households. This type of survey not only covers formally employed individuals but also considers workers who are not included in formal employment, providing a more comprehensive view of the labor market. These two surveys complement each other, and together they build a complete picture of labor market analysis in the United States, providing key reference information for policymakers, economists, and investors.
The job market is often affected by factors such as holidays, weather changes, and the agricultural cycle during different seasons, causing data to fluctuate in the short term. To eliminate the bias caused by these seasonal factors, non-farm payroll data are seasonally adjusted. Through statistical modeling, analysts are able to correct the data to ensure comparability across time.
Seasonally adjusted data not only provide a more accurate picture of the overall trend of the economy but also provide policymakers and investors with a more reliable basis for analysis. Such adjustments help them identify potential economic signals, make more accurate economic forecasts, and formulate more reasonable policies and investment strategies accordingly, thus optimizing the decision-making process.
In conclusion, non-farm payroll data is not only an important indicator for assessing the health of the U.S. economy but also has a significant impact on the financial markets, especially the stock market and foreign exchange market. And the market reacts instantly to the data after its release. Both the foreign exchange market and the stock and bond markets are very sensitive to the non-farm payroll data. Therefore, traders need to pay attention to the non-farm payroll data published point in time and, according to the data results, adjust the trading strategy.?

Non-Farm Payrolls Data Release Schedule 2024
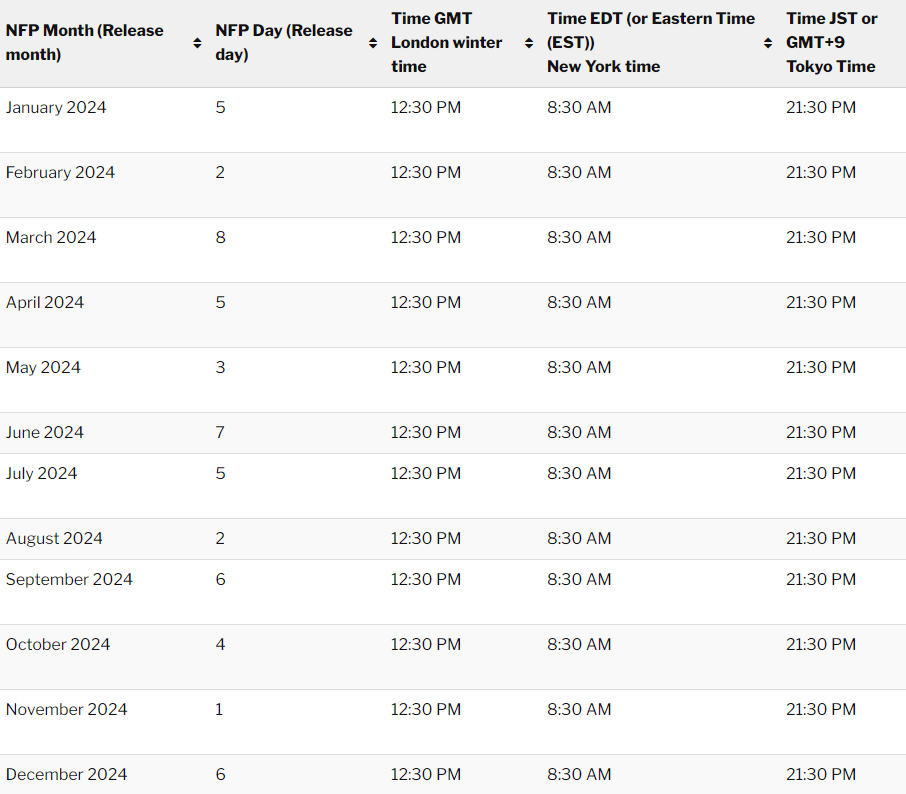
From the image above, we can see the exact time of release of non-farm payroll data. Generally, the non-farm payroll data released in the current month is from the previous month. For example, the non-farm payrolls data released on 5 January 2024 is actually the December 2023 non-farm payrolls data.
It is important to note that, unless there are a few exceptions due to market holidays, the non-farm payroll data is usually released on the first Friday of the month at 8:30 a.m. EST. Converted to Beijing time, daylight saving time corresponds to 20:30. Winter time is 21:30. Understanding this schedule helps investors get timely information and adjust their trading strategies.
January 2024 non-farm payroll data will be released in February 2024; the specific release time for the United States is 8:30 a.m. EST on February 2. 2024. 9:30 p.m. Beijing time on 2 February 2024. 13 February of the same month, 8:30 a.m. EST, will be released in January 2024. the actual income data.
Nonfarm payroll data for February 2024 will be released in March 2024 at 8:30 a.m. EDT on 8 March 2024. 9:30 p.m. PST on 8 March 2024. Subsequently, on 11 March at 10:00 a.m. EDT.Employment and unemployment by state for January 2024 (monthly) will be released.On 12 March at 8:30 a.m., real income data for February 2024 will be released. And on March 22 at 10:00 a.m., employment and unemployment by state for February 2024 (monthly) will be released.
The non-farm payroll data for March 2024 will be released in April 2024 at 8:30 a.m. ET on 5 April 2024. 9:30 p.m. GMT on 5 April 2024. On 10 April at 8:30 a.m. ET, the real income data for March 2024 will be released. Then, on 19 April at 10:00 a.m., employment and unemployment by state for March 2024 (monthly) will be released.
Nonfarm payroll data for April 2024 will be released in May 2024 at 8:30 a.m. ET on 3 May 2024. 8:30 p.m. GMT on 3 May 2024. Subsequently, real earnings data for April 2024 will be released on 15 May, and state employment and unemployment for April 2024 (monthly) will be released on 17 May.
Non-farm payroll data for May 2024 will be released in June 2024 at 8:30 a.m. EST on 7 June 2024. GMT is 8:30 p.m. on 7 June 2024.Subsequently, real earnings data for May 2024 will be released on 12 June, and state employment and unemployment for May 2024 will be released at 10:00 a.m. on 25 June. situation (monthly).
Non-farm payroll data for June 2024 will be released in July 2024 at 8:30 a.m. EST on 5 July 2024. BST is 8:30 p.m. on 5 July 2024.Subsequently, real earnings data for June 2024 will be released at 8:30 a.m. on 11 July, and June 2024 employment and unemployment by state (monthly) will be released at 10:00 a.m. on 19 July. Employment and Unemployment by State (monthly).
Non-farm payroll data for July 2024 will be released in August 2024 at 8:30 a.m. EST on 2 August 2024. Beijing time is 8:30 p.m. on 2 August 2024.Subsequently, real earnings data for July 2024 will be released at 8:30 a.m. on August 14. and state-by-state employment and unemployment (monthly) will be released at 10:00 a.m. on August 16.
Non-farm payroll data for August 2024 will be released in September 2024 at 8:30 a.m. EST on 6 September 2024. BST is 8:30 p.m. on 6 September 2024.This will be followed by the release of real earnings data for August 2024 on 11 September at 8:30 a.m., and on 20 September at 10:00 a.m., the release of the August 2024 Employment and Unemployment by State (monthly).
Non-farm payroll data for September 2024 will be released in October 2024 at 8:30 a.m. EST on October 4. 2024. BST is 8:30 p.m. on 4 October 2024. Subsequently, real earnings data for September 2024 will be released at 8:30 a.m. on 10 October, and at 10:00 a.m. on 22 October, real income data for Employment and Unemployment by State for September 2024 (monthly).
Non-farm payroll data for October 2024 will be released in November 2024 at 8:30 a.m. EST on 1 November 2024... 9:30 p.m. GMT on 1 November 2024... Subsequently, real income data for October 2024 will be released at 8:30 a.m. on November 13 and at 10:00 a.m. on November 19. Employment and Unemployment by State for October 2024 (monthly).
Non-farm payroll data for November 2024 will be released in December 2024 at 8:30 a.m. EST on 6 December 2024. 9:30 p.m. GMT on 6 December 2024. Subsequently, real earnings data for December 2024 will be released at 8:30 a.m. on 11 December and at 10:00 a.m. on 20 December 2024 Employment and Unemployment by State (Monthly).
Non-farm payroll data for December 2024 are expected to be released in January 2025 at 8:30 a.m. EST on 10 January 2025 and at 9:30 p.m. GMT on 10 January 2025. followed by real earnings data for November 2024 on 15 January at 8:30 a.m.
The 2024 non-farm payroll data is a direct reflection of economic activity and consumer spending, and investors closely monitor its release to determine market trends. Its key indicators affect market sentiment and the Federal Reserve's monetary policy expectations, which in turn affect the stock market and the U.S. dollar exchange rate. By interpreting these data, investors can better judge the direction of the economy and adjust their investment strategies.
Nonfarm Payrolls Data-Focused Interpretation Tips
When interpreting non-farm payroll data, the number of new non-farm payrolls is the core indicator, reflecting the health of the job market. The unemployment rate, labor force participation rate, and payroll growth rate are also important, revealing the balance between labor supply and demand, the labor supply situation, and the impact of rising payrolls on inflation, respectively. Combining these indicators provides a more complete assessment of economic trends.
The number of new non-farm payrolls is a key indicator. A higher-than-expected number of non-farm payrolls is usually indicative of a strong economy, which can drive the stock market higher and the US dollar stronger; a lower-than-expected number can reflect a slowdown in the economy, triggering negative sentiment in the market. The unemployment rate is also important; falling usually means a tight labor market and good economic performance; rising may indicate that companies are hiring less and the economy is weakening, which has an impact on market sentiment.
The labor force participation rate measures the proportion of the working-age population actually participating in the labor market. Even if the unemployment rate is low, a fall in the labor participation rate may indicate that many people are dropping out of the market, suggesting that the employment situation is not as rosy as it appears. Wage growth is a key indicator of inflationary pressures. Excessive wage growth suggests a tight labor force, which could be inflationary and prompt the Fed to tighten policy, while lower-than-expected growth suggests that inflationary pressures are small and easing may continue.
However, it is important to note that when interpreting the non-farm payroll data, one should not rely solely on one indicator but need to comprehensively analyze a number of data, such as the number of new jobs created, the unemployment rate, the labor force participation rate, and the rate of payroll growth, in order to get a full picture of the true state of the labor market. For example, if the unemployment rate falls while the labor force participation rate also falls, this may not be a positive sign but rather a reflection of potential weakness in the labor market.
Similarly, if there is an increase in the number of new jobs but the unemployment rate also rises, it may indicate that more people are re-entering the labor market, showing increased confidence in the economic recovery. In this case, a rise in the unemployment rate is not necessarily a negative signal but may instead signify increased labor market activity. Economic trends and market movements can be more accurately judged through multi-dimensional data analysis.

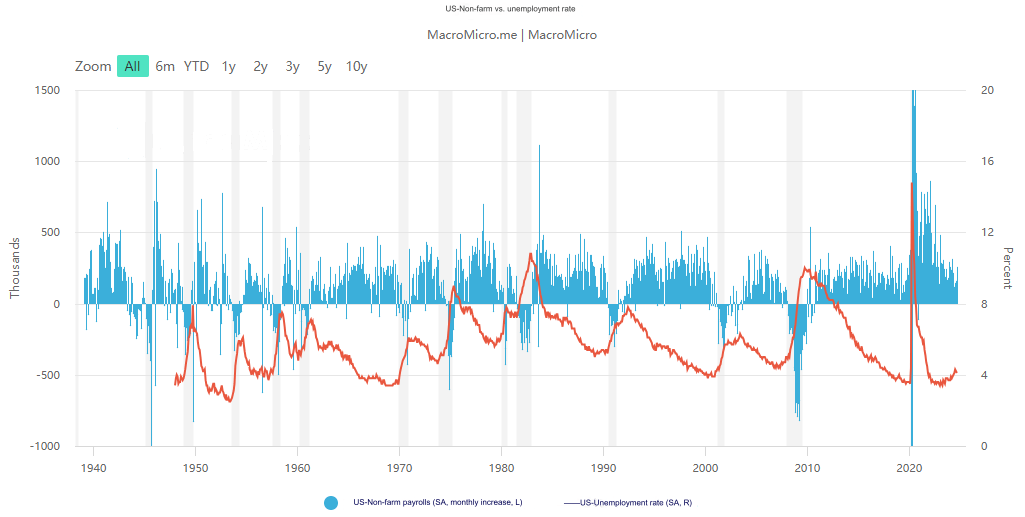
As shown in the above chart, the decline in new non-farm payrolls in 2009 was accompanied by a rise in the unemployment rate, suggesting greater pressure on the labor market. And economic conditions worsened, showing signs of recession. However, in 2020. despite a rise in the unemployment rate, there was a simultaneous increase in the number of new jobs added, and the economy showed no signs of recession.
The non-farm payroll data details employment changes across industries, especially the performance of key sectors such as manufacturing, construction, services, and retail, which provide important industry trend references for investors and analysts. For example, employment growth in the manufacturing and construction sectors usually indicates increased business investment, signaling a possible further expansion of the economy.
Employment data by industry not only reflects overall economic conditions but also reveals specific trends in each industry. If there are large fluctuations in employment in certain key industries (e.g., technology, finance, energy), it may suggest that the industry is facing specific challenges or opportunities. Such changes could affect the outlook for the sector and be directly reflected in the performance of the underlying stocks. Therefore, investors closely monitor employment changes in these sectors to adjust their investment strategies to capture potential opportunities or avoid risks.
Non-farm payroll data are seasonally adjusted to remove employment fluctuations due to short-term factors such as holidays and weather. Therefore, special attention should be paid to the'seasonally adjusted’ data rather than the ‘raw data’ when interpreting the data. Such adjusted non-farm payroll data can more accurately reflect the long-term trend of the economy, so that analysts can better grasp the real trend of economic development and avoid short-term fluctuations brought about by the misleading.
If the non-farm payroll data of a particular month show abnormal growth or decline, it is necessary to consider whether they are affected by specific seasonal factors. For example, the end-of-year holiday shopping season usually leads to temporary employment surges in the retail and service sectors, and such short-term employment increases do not necessarily reflect the true state of the economy. Analysts should take into account the specific context to fully assess the actual economic activity behind the data.
Non-farm payroll data are usually revised from the previous two months, and these revisions are also important. If the previous months' employment data are revised significantly up or down, it could have a significant impact on the market. For example, even if the current data is unsatisfactory, if the previous months' data is revised significantly upward, the market may assume that economic trends remain healthy.
The Federal Reserve's monetary policy is closely related to the labor market, so changes in non-farm payroll data will directly affect the Fed's decision-making expectations for future interest rate hikes or cuts. If the non-farm payrolls data performance is strong, the Fed may accelerate the pace of interest rate hikes; conversely, if the job market is weak, the Fed may delay interest rate hikes or even consider rate cuts. Investors usually base their decisions on non-farm payroll data to predict the Fed's policy trends so as to develop the corresponding investment strategy.
In interpreting the non-farm payroll data, investors should focus on a number of key indicators, such as the number of new jobs, the unemployment rate, the labor force participation rate, the rate of payroll growth, and industry breakdowns. And combined with the Fed's monetary policy expectations and market reaction, comprehensively analyze the potential impact of these data on the economy and the market so as to make more reasonable investment decisions.
2024 Non-Farm Payrolls Data Release Schedule and Values
| Reference Month |
Release Date |
Release time (EST) |
Beijing time |
Published value |
Forecast |
Revised |
| Jan-24 |
2-Feb-24 |
8:30 AM |
21:30 pm |
353k |
187k |
216k |
| Feb-24 |
8-Mar-24 |
8:30 AM |
21:30 pm |
275k |
198k |
229k |
| Mar-24 |
5 April 2024 |
8:30 AM |
21:30 pm |
303k |
212k |
270k |
| April 2024 |
3-May-24 |
8:30 AM |
20:30 pm |
175k |
238k |
315k |
| May-24 |
7-Jun-24 |
8:30 AM |
20:30 pm |
272k |
185k |
175k |
| Jun-24 |
5-Jul-24 |
8:30 AM |
20:30 pm |
206k |
191k |
218k |
| Jul-24 |
2-Aug-24 |
8:30 AM |
20:30 pm |
114k |
176k |
179k |
| Aug-24 |
6-Sep-24 |
8:30 AM |
20:30 pm |
142k |
164k |
89k |
| Sep-24 |
4-Oct-24 |
8:30 AM |
20:30 pm |
254k |
140k |
159k |
| Oct-24 |
1-Nov-24 |
8:30 AM |
20:30 pm |
12k
|
113k |
223k |
| Nov-24 |
6-Dec-24 |
8:30 AM |
21:30 pm |
227k |
200k |
36k |
| Dec-24 |
10-Jan-25 |
8:30 AM |
21:30 pm |
256k |
160K |
212K |
Disclaimer: This material is for general information purposes only and is not intended as (and should not be considered to be) financial, investment, or other advice on which reliance should be placed. No opinion given in the material constitutes a recommendation by EBC or the author that any particular investment, security, transaction, or investment strategy is suitable for any specific person.


