When beginners enter the foreign exchange market, they usually use some simple indicators. Some want to judge the trend by Moving Average, while others will use shock indicators to judge the current market sentiment. Among them, RSI is one of the most popular indicators.
The Purpose of Using RSI
The Relative Strength Index (RSI) is perhaps the most well-known indicator, as it can be used to identify a market that is in a "overbought" or "oversold" state. The value of the strength indicator is between 0 and 100, with 70 to 100 indicating overbought and an opportunity to reverse downward; 30-0 indicates oversold, indicating an opportunity to rebound upwards.

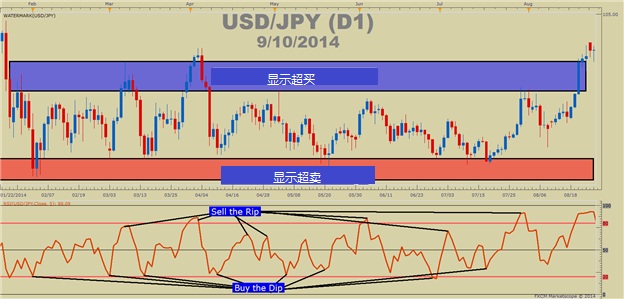
Let's take a look at the trend of the US dollar/Japanese yen in the first half of 2014. The RSI indicator is the most accurate in a range of volatile markets, fully in line with the principle of "buy low, sell high".
After reading the above picture, you may think that RSI is an ideal tool for foreign exchange trading. But to some extent, it may only be in line with 'low buy'; In the breakthrough market, the principle of "high selling" sometimes fails.
Oversimplifying indicators may result in more harm than good. Oversimplification refers to mechanically following the trading pattern of "buying below 30 or breaking above 30, selling above 70 or breaking below 70".
Sometimes there may be malfunctions
There are also times when RSI malfunctions, and sometimes breakthroughs occur when the trend is strong.
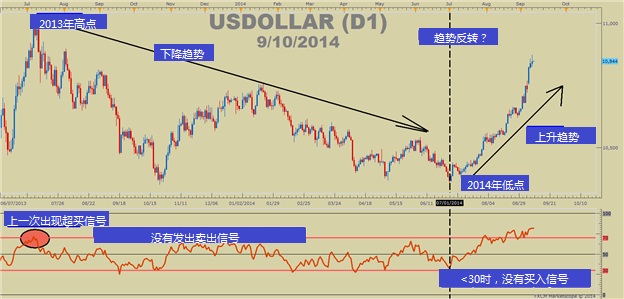
According to the Elliott Wave Principle, after the first breakout of the exchange rate, there are usually multiple subsequent breakouts and fluctuations above the upward trend line. We imagine that if the market breaks through to a higher level, it is quite dangerous to short in the overbought market, especially without proper risk management.

In the first 7 months of the figure, RSI indicators consistently displayed overbought signals; Until July 2013, the us dollar index began to decline overall. If traders recognize the change in this trend and hope to sell after the RSI breaks 70, it is regrettable that they did not wait for this opportunity until 13 months later; But it was already too late.
How to Apply the Strategy
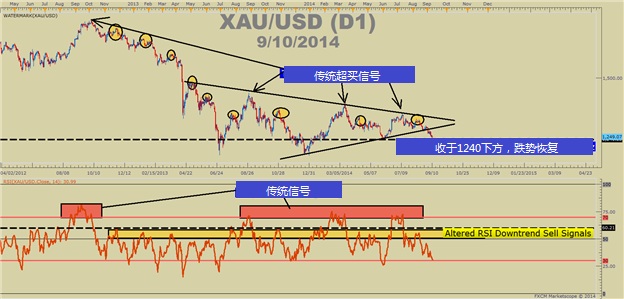
When the trend is strong, adjustments should be made to the use of RSI indicators - resetting the standards for defining "overbought" and "oversold" signals. In an upward trend, overbought signals may appear within 40-50 basis points; During a downward trend until the end of the trend, oversold signals may appear within 50-60 basis points.

After lowering the overbought index, the circle in the figure shows buying opportunities, and the price level highlighted by yellow circles in the figure shows the entry signal issued after appropriately lowering the overbought range.
After entering the market for short selling, the stop loss point can be set above the entry point with a certain proportion of the average true amplitude (ART); If there is a lower recent high, it can also be used as a stop loss point. This method can be used for trend market trading, such as daily charts and K-line charts in other time frames.
【 EBC Platform Risk Reminder and Disclaimer 】: There are risks in the market, and investment needs to be cautious. This article does not constitute investment advice.


