The Alpha Indicator is Trading Central's own proprietary system. Its key advantage is that it can be overlaid directly on candlestick charts, showing market sentiment while providing real-time buy and sell signals, as well as alerts for market turning points.
How to Access the Alpha Indicator
To use the Alpha Indicator, you first need to download it. On the EBC official website, navigate to Market Analysis under the Trading section.

Scroll down to the Alpha Indicator page and click Get Indicator.
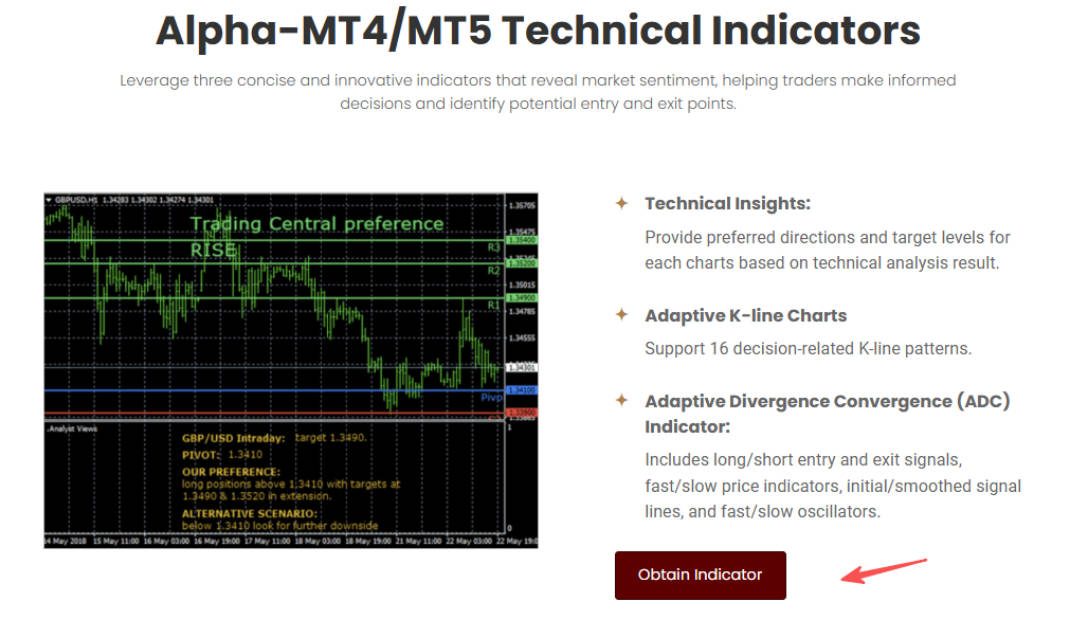
Once logged in, go to Market Analysis under Trading Tools.

Within Market Analytics, select MT4/MT5 Indicators, then download the indicator. Once downloaded, click Install.
Trading Central's program automatically installs it on MT4/MT5. so you don't need to manually move files into specific folders like with other indicators.
How to Use the Indicators
Open MT4. then go to Insert → Indicators → Custom. The section highlighted here contains Trading Central's proprietary indicators.
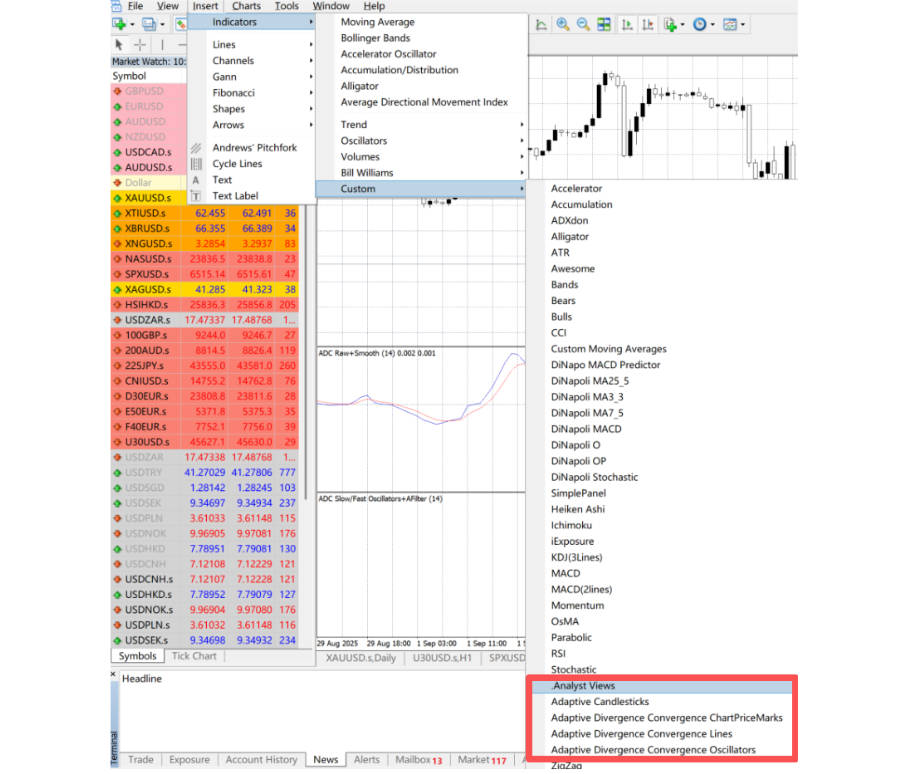
Trading Central provides three main indicators:
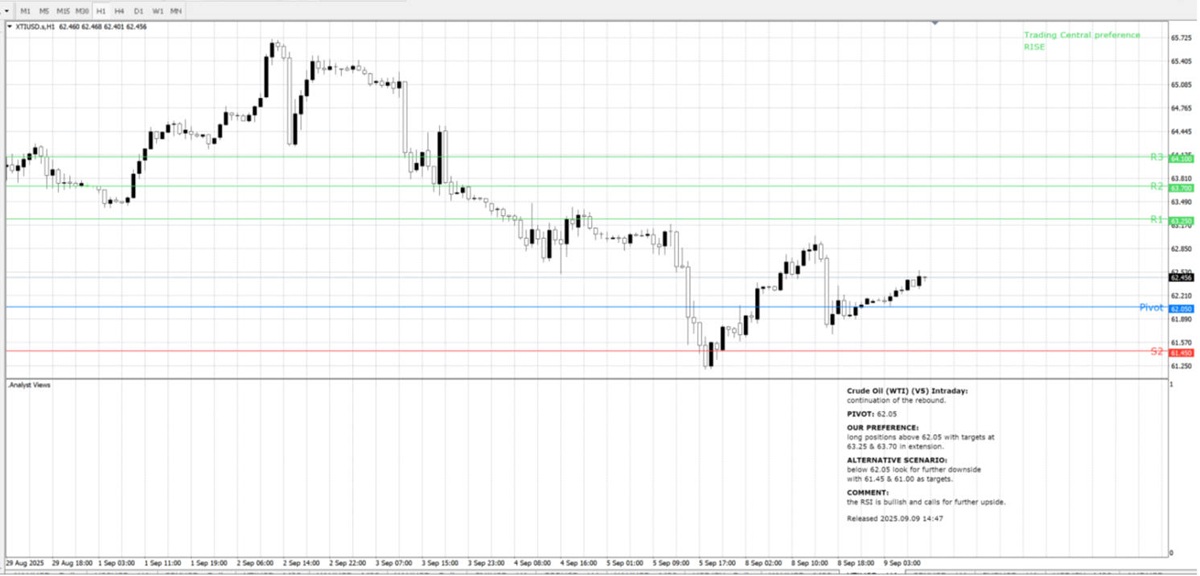
1) Analyst Views
Analyst Views highlight key levels and technical commentary beneath the candlestick chart. Pivot points are also marked directly on the chart.
2) Adaptive Candlesticks
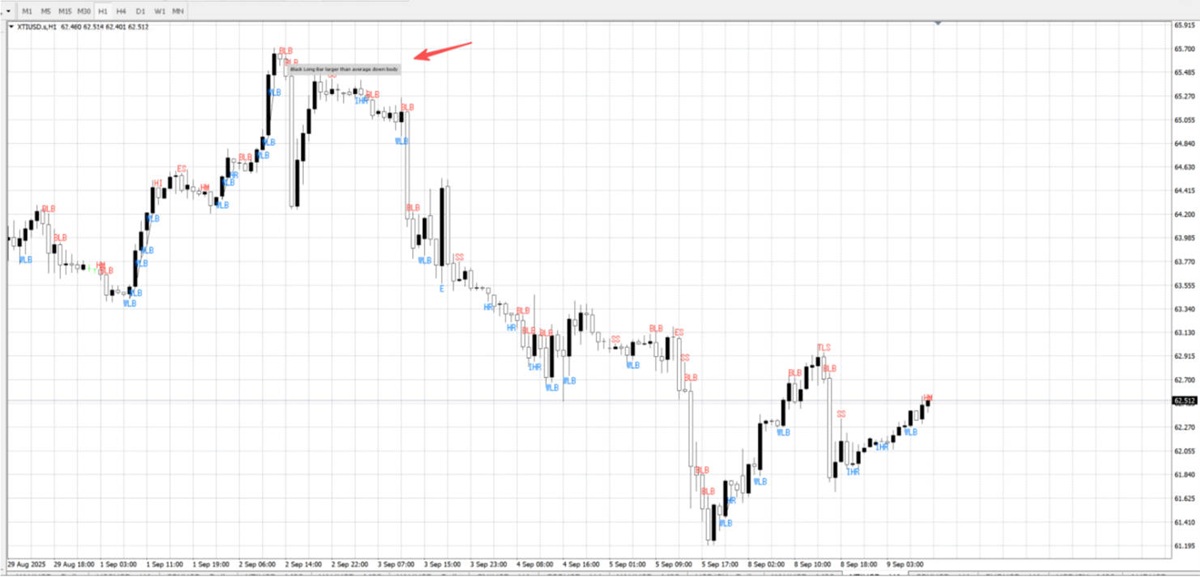
Adaptive Candlesticksmark turning points on the chart and identifies potential structural patterns. It includes 16 of the most reliable candlestick formations. Hover over a signal for an explanation.
3) Adaptive Divergence Convergence (ADC) Indicators
Listed as Adaptive Divergence Convergence ChartPriceMarks / Oscillators / Lines, these work together as a complete suite:
Entry/exit signals appear as labels: SX for closing a short position, LX for closing a long position.
Fast/slow price indicators work like typical moving averages, using golden cross and dead cross signals to indicate entries and exits.
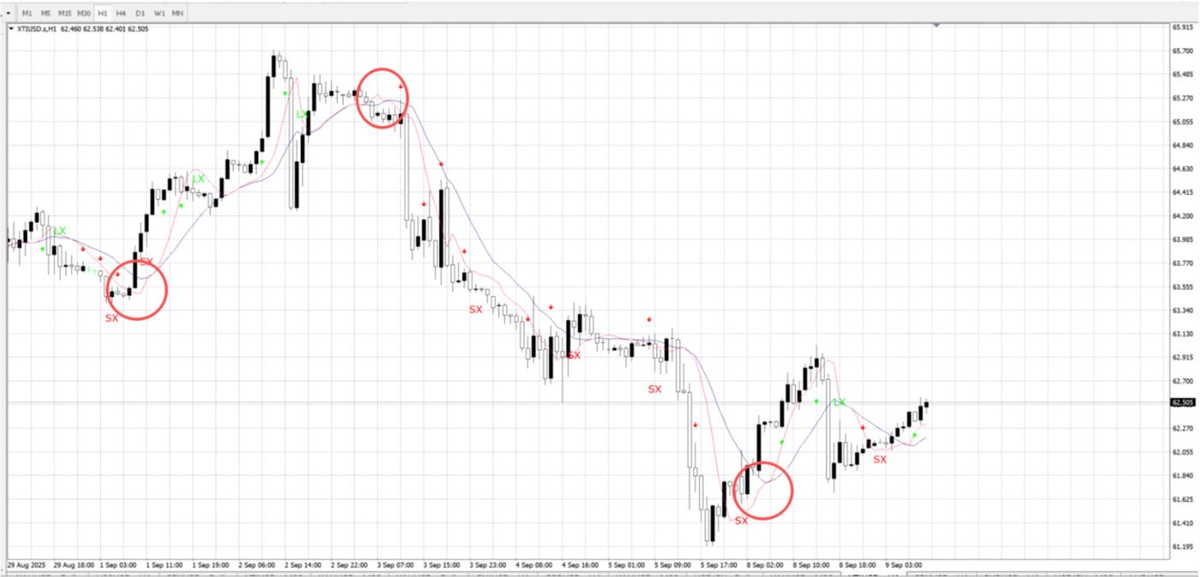
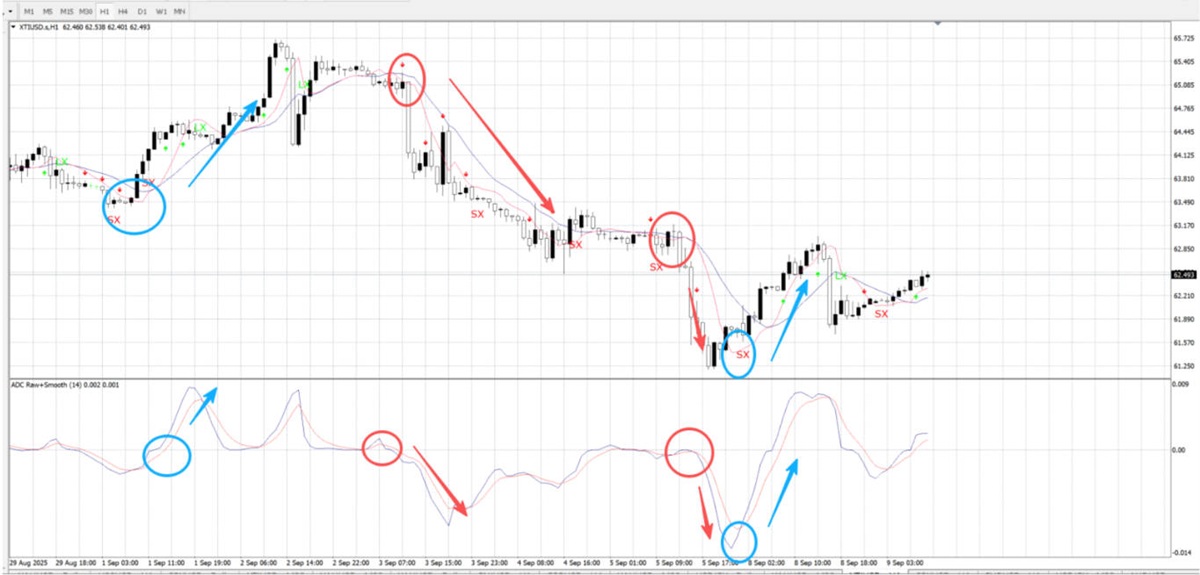
The initial line is the difference between the fast and slow price indicators, similar to MACD.
When the initial line is above the smoothed line and both are above zero (fast signal exceeding slow) with the fast signal rising, this indicates sustained upward momentum – a buy signal. A downward fast signal indicates a sell.
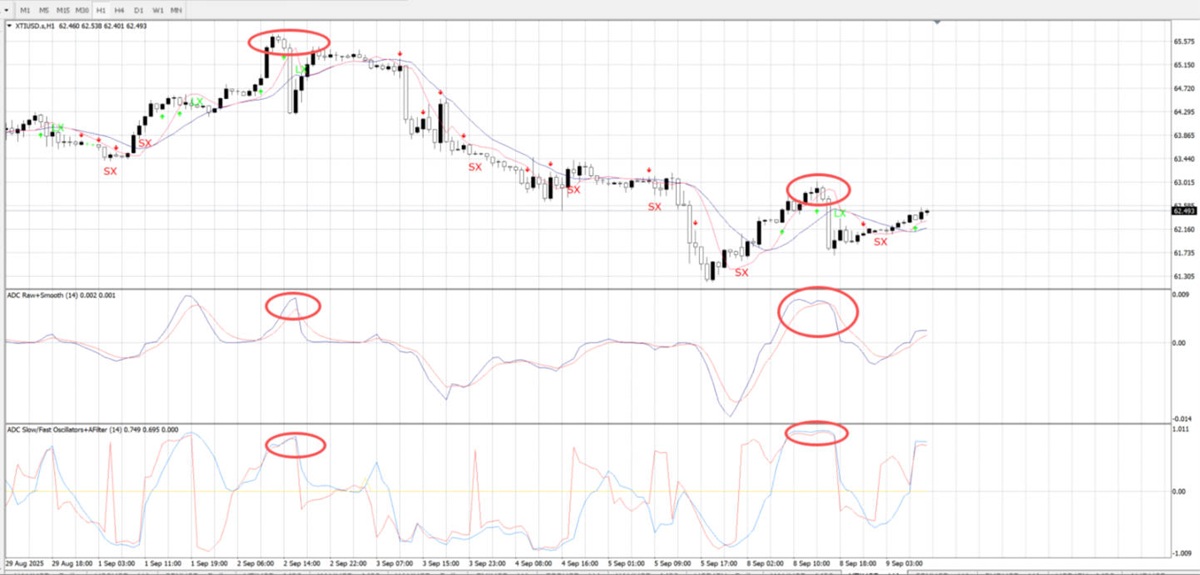
Like most oscillators, when they reach overbought or oversold zones, particularly when both lines converge at extremes, and combined with the price indicators and signal lines, the signals become highly reliable.
Conclusion
In short, Trading Central's proprietary indicators provide structure, clarity and actionable signals. By combining these three indicators, you can identify overlapping signals to improve the accuracy of your trades.
Disclaimer: This material is for general information purposes only and is not intended as (and should not be considered to be) financial, investment or other advice on which reliance should be placed. No opinion given in the material constitutes a recommendation by EBC or the author that any particular investment, security, transaction or investment strategy is suitable for any specific person.


