The shooting star candlestick pattern is one of technical analysis's most commonly recognised reversal signals. Traders and investors use this pattern to anticipate potential price reversals after an uptrend, making it an essential tool for identifying bearish sentiment in financial markets.
While many traders rely on the shooting star pattern to enter short positions or exit long trades, the question remains: how reliable is this candlestick pattern in predicting market reversals, as traders must consider several factors before making trading decisions?
Formation and Characteristics of the Shooting Star Pattern

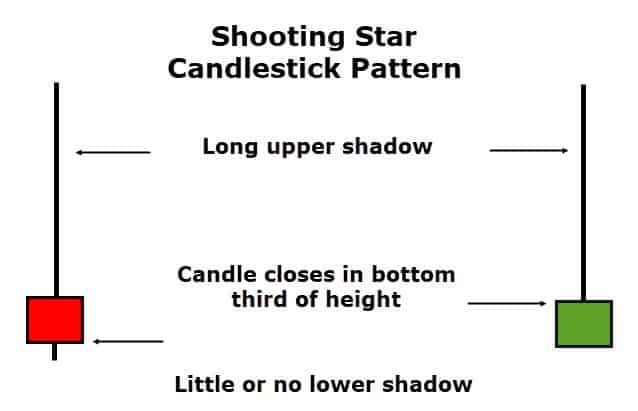
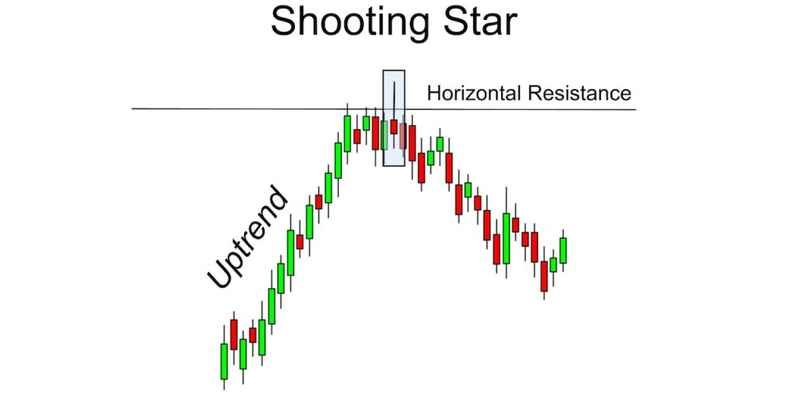
Before deciding whether the shooting star pattern is reliable or detrimental, we must understand its formation and characteristics. Firstly, the shooting star pattern forms after an uptrend and consists of a single candlestick with a small body near the low of the session and a long upper shadow.
The long upper wick suggests that buyers initially drove the price higher. However, by the end of the trading session, selling pressure overcame the initial bullish momentum, forcing the price to close near its opening level. This rejection of higher prices is often seen as a warning that the current uptrend may weaken and that a reversal could be on the horizon.
For the shooting star to be considered valid, the upper wick should be at least twice the length of the body, indicating significant rejection of higher prices. Additionally, the pattern is more reliable after a strong uptrend, suggesting buyers are losing control and sellers are gaining strength. A confirmation candle, typically a bearish candlestick following the shooting star, further increases the reliability of the pattern by confirming that sellers are taking control of the market.
How Reliable Is the Shooting Star Candlestick as a Reversal Signal?
The reliability of the shooting star candlestick pattern varies depending on market conditions. For example, a single shooting star may not be enough to reverse the price movement in strong uptrends. If bullish momentum remains intact, sellers may struggle to lower prices, and the pattern may result in a short-term pullback rather than a full reversal.
However, if a shooting star forms near a key resistance level, it becomes more significant because it signals buyers failed to break through. When combined with other technical indicators such as the Relative Strength Index (RSI) or Bollinger Bands, the shooting star can serve as a more reliable reversal signal.
In ranging or choppy markets, the effectiveness of the shooting star pattern is often reduced. Price movements in such markets tend to lack strong directional trends, making reversal patterns less meaningful. A shooting star within a sideways trading range may not indicate a true reversal, as the price could continue fluctuating within its established boundaries. Traders should assess the broader trend context before acting on the shooting star signal.
Moreover, the shooting star pattern may produce false signals in volatile markets. Market noise and sudden price fluctuations can create candlestick patterns that resemble a shooting star without indicating a genuine reversal. Traders should exercise caution in such environments and seek additional confirmation before entering trades based solely on the pattern.
False Signals and How to Avoid Them
As mentioned, the shooting star pattern is not always a perfect indicator, and false signals can occur. Recognising the conditions that lead to unreliable shooting star formations can help traders avoid unnecessary losses. One common issue is trading a shooting star without confirmation. Entering a trade immediately after spotting the pattern can be risky, as the price may continue to rise instead of reversing. Waiting for additional bearish confirmation before taking a position can reduce the likelihood of falling into a false signal trap.
Another factor that weakens the reliability of the shooting star is when it appears in a weak uptrend or a choppy market. If the preceding bullish move is not strong enough, the shooting star may not have much significance. A pattern that forms after a small upward movement lacks the selling pressure needed for a meaningful reversal. Traders should focus on shooting stars that appear after extended bullish trends, as they are more likely to indicate exhaustion.
Ignoring broader market trends can also lead to misinterpreting shooting star signals. If the overall trend remains bullish and strong fundamental factors support higher prices, a single shooting star may not be enough to change market direction. In such cases, the pattern may result in only a short-term pullback rather than a full reversal.
Confirmation Strategies for the Shooting Star Pattern

To increase the reliability of the shooting star candlestick pattern, traders often use it in conjunction with other technical indicators and chart patterns. Combining it with moving averages can help confirm whether the market is reversing or experiencing a temporary pullback. If a shooting star appears near a major moving average, such as the 50-day or 200-day moving average, it adds further weight to the bearish signal.
Support and resistance analysis is another crucial factor in determining the reliability of a shooting star. When the pattern forms at a well-established resistance zone, it suggests that buyers are struggling to push the price higher, increasing the likelihood of a reversal. A failed attempt to break above a resistance level, followed by the formation of a shooting star, often signals that selling pressure is about to take over.
Traders also look at Fibonacci retracement levels when assessing the validity of a shooting star pattern. If the pattern appears near a key Fibonacci resistance level, such as the 61.8% retracement level, it strengthens the bearish case, as historical price action suggests that the market tends to reverse from these levels.
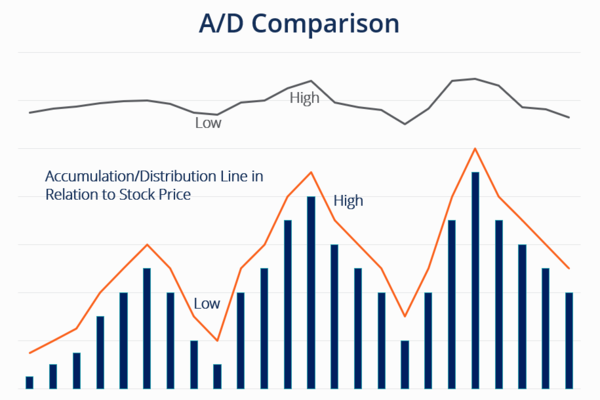
Volume analysis further enhances the reliability of the shooting star. When the pattern accompanies high trading volume, it suggests that institutional investors or large traders are selling, increasing the chances of a trend reversal. On the other hand, if the pattern forms with low volume, it may indicate that the selling pressure is weak, making the reversal less likely.
Conclusion
The shooting star candlestick pattern can be a highly effective tool for identifying potential bearish reversals, but its reliability depends on the market context, volume, and confirmation signals. While the pattern signals buyers are losing control and selling pressure is increasing, it does not always guarantee a sustained downtrend.
Traders should use additional technical indicators, support and resistance levels, and confirmation candles to improve the accuracy of their trades, as no single indicator guarantees success.
Disclaimer: This material is for general information purposes only and is not intended as (and should not be considered to be) financial, investment or other advice on which reliance should be placed. No opinion given in the material constitutes a recommendation by EBC or the author that any particular investment, security, transaction or investment strategy is suitable for any specific person.


