In the dynamic world of financial markets, traders often encounter various Chart Patterns that signal potential price movements. One such pattern is the "Dead Cat Bounce," a term that, despite its morbid imagery, holds significant importance in trading strategies.
In reality, the pattern vividly illustrates a temporary recovery in the price of a declining asset. Nevertheless, understanding this pattern can help traders make informed decisions, avoid potential pitfalls, and capitalise on short-term market movements.
Understanding the Dead Cat Bounce

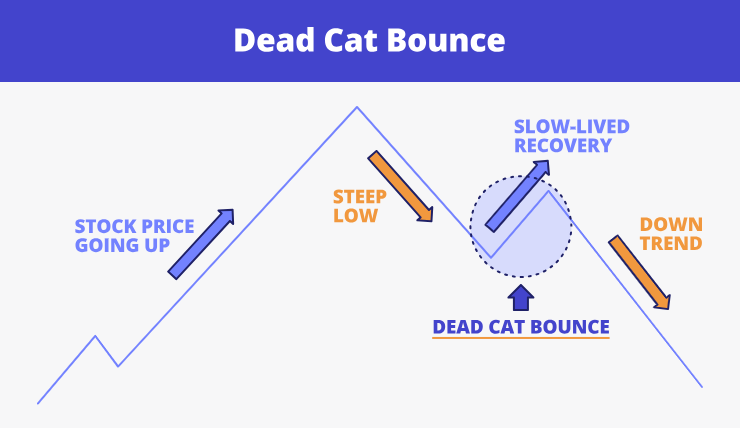
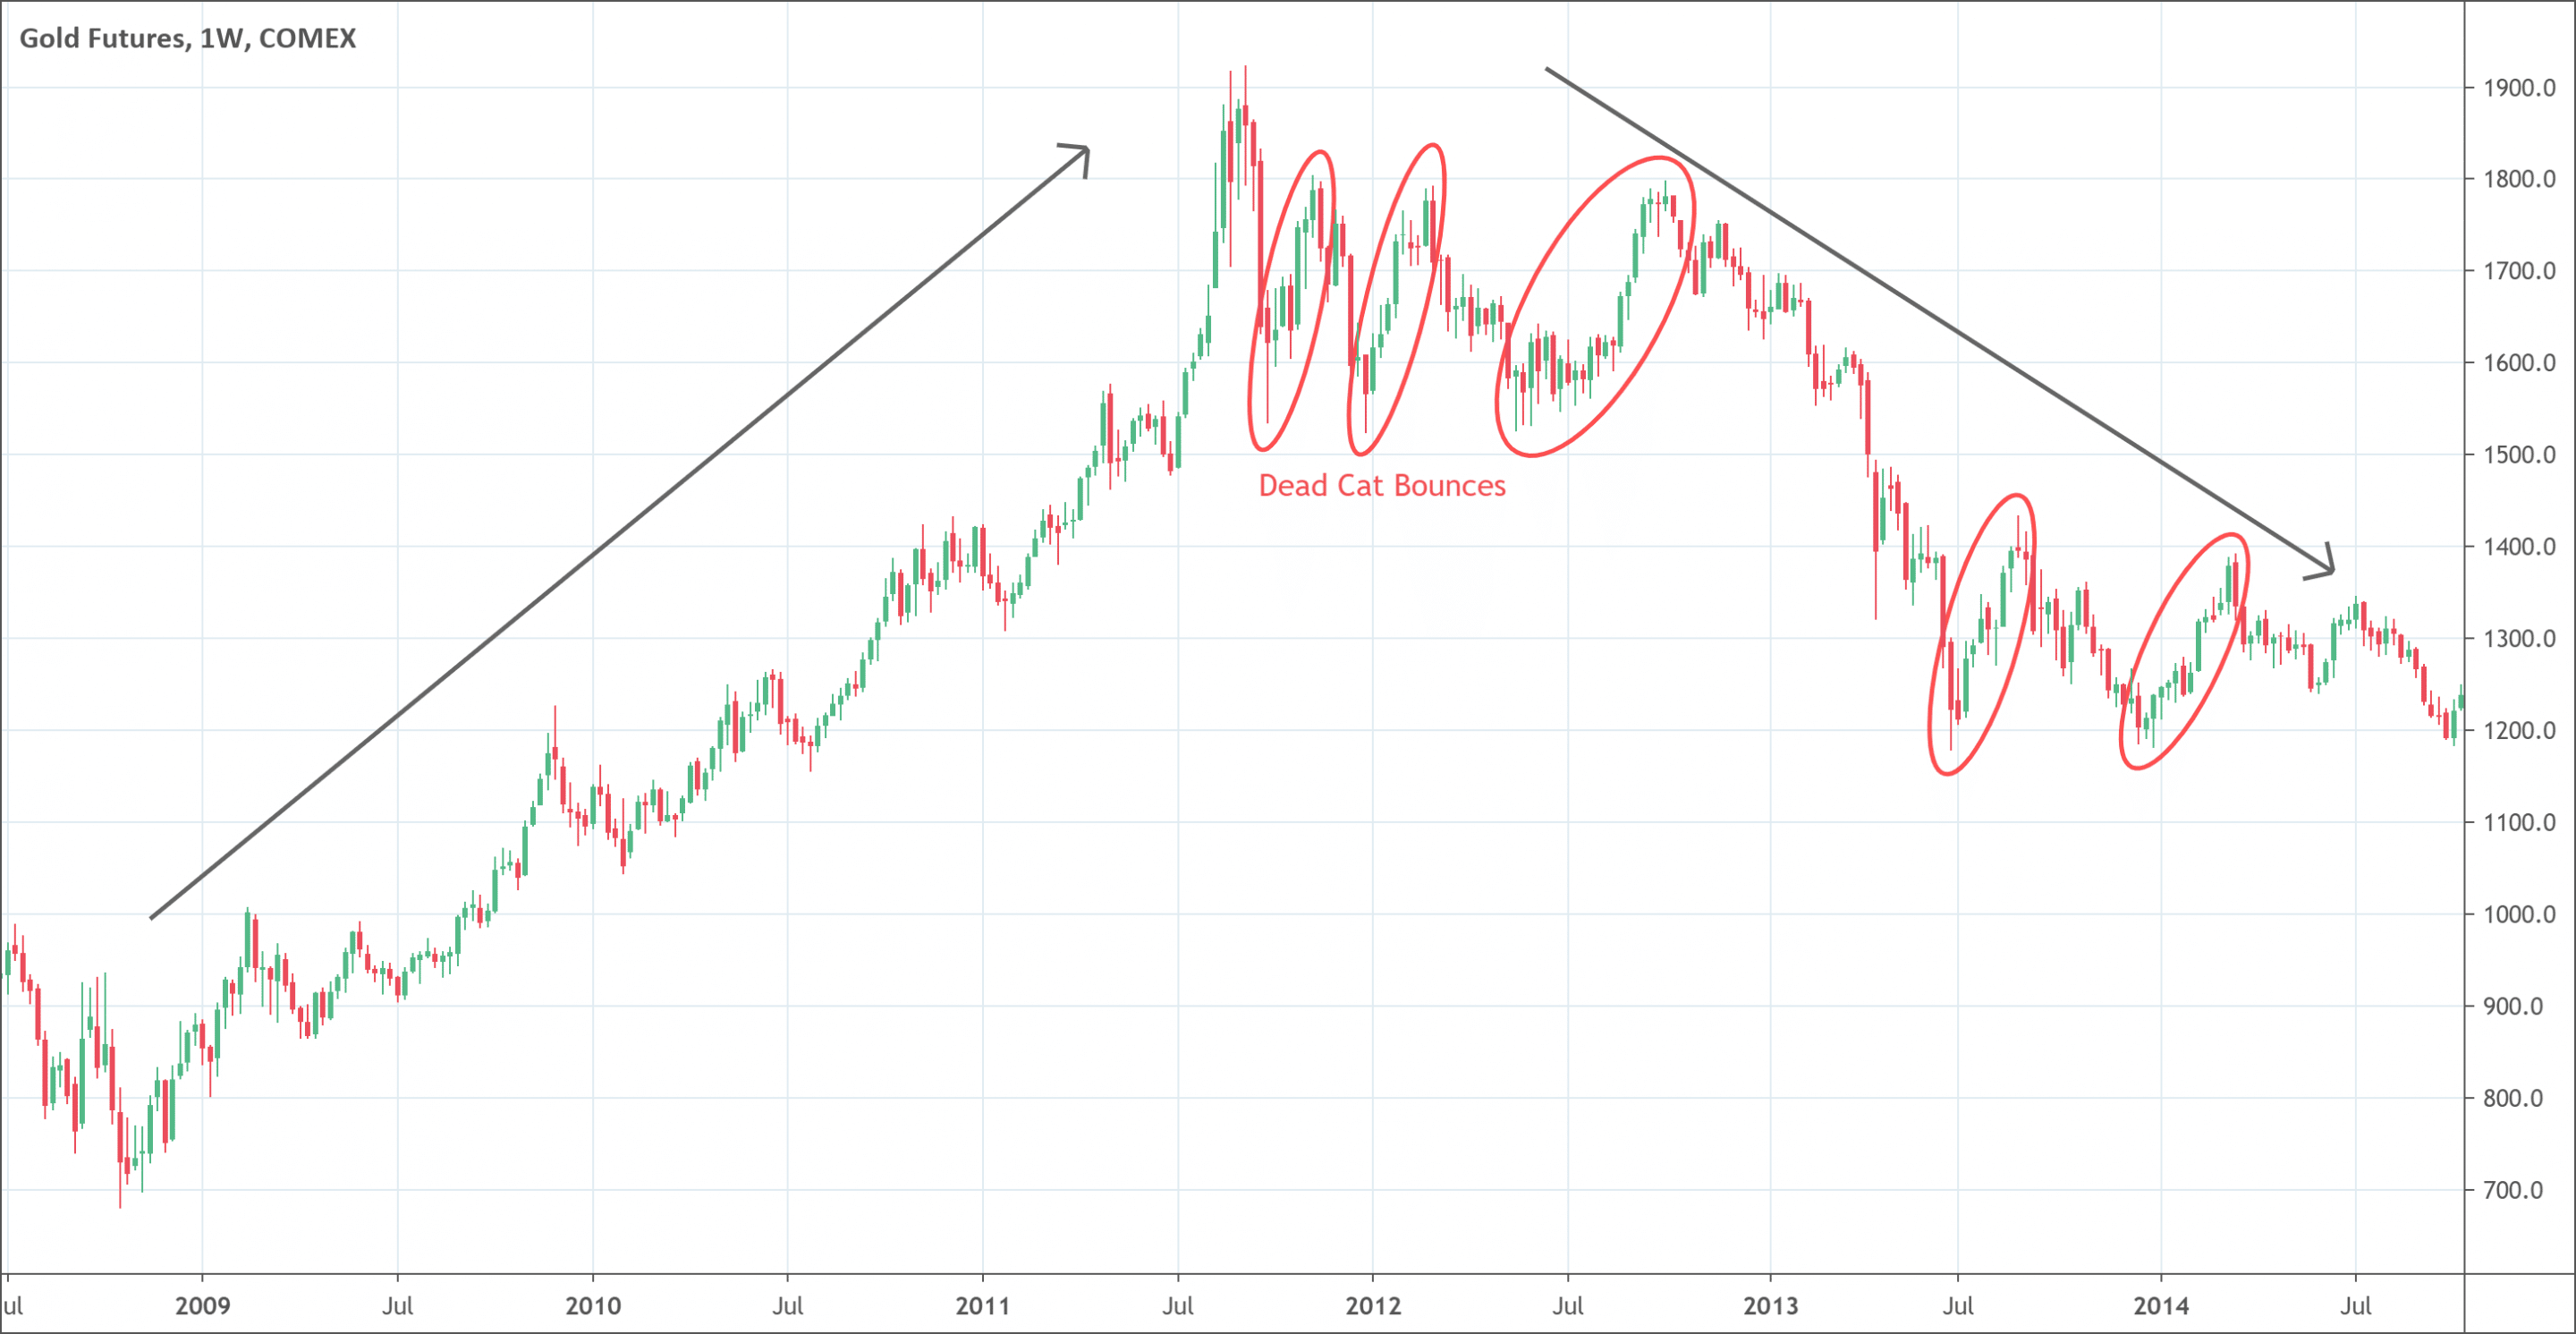
The Dead Cat Bounce refers to a brief and temporary recovery in the price of a declining asset, followed by a continuation of the downtrend. The term originates from the notion that "even a dead cat will bounce if it falls from a great height," implying that a minor recovery is not indicative of a reversal in the prevailing downtrend.
This phenomenon is often observed in bear markets, where a short-lived rally can mislead investors into believing that the market has bottomed out, only for prices to decline shortly thereafter.
Historical Context and Origin
The phrase "Dead Cat Bounce" was first popularised in the financial press in December 1985. Journalists Chris Sherwell and Wong Sulong of the Financial Times used it to describe a brief recovery in the Singaporean and Malaysian stock markets during a recession. Despite the temporary uptick, both markets continued to decline, illustrating the deceptive nature of such rebounds.
Since then, the term has been widely adopted in financial circles to caution against mistaking short-term recoveries for genuine market reversals. It reminds us that not all price increases signify a true turnaround, especially in the absence of supporting fundamentals.
Technical Characteristics of the Pattern
From a technical analysis perspective, a Dead Cat Bounce is characterised by a sharp decline in price, a brief recovery, and a subsequent continuation of the downtrend. This pattern can be challenging to identify in real time, as the temporary recovery may resemble a genuine reversal. Key features include:
An initial significant drop in price due to negative news or market sentiment.
A short-lived rally, often driven by short-covering or bargain hunting.
A resumption of the downward trend as selling pressure returns.
Recognising these elements requires careful analysis of price movements and volume patterns.
Causes Behind the Bounce
Several factors can contribute to the formation of a Dead Cat Bounce:
Short-covering by traders who had bet against the asset can lead to a temporary increase in buying pressure. As these traders close their positions, the resulting demand can cause prices to rise briefly.
Speculative buying by investors hoping to capitalise on perceived low prices can also drive the short-term rally. However, without fundamental improvements, this buying interest is often unsustainable.
Positive news or rumours may temporarily boost investor sentiment, leading to a brief price increase. Yet, if the underlying issues causing the initial decline remain unaddressed, the asset will continue its downward trend.
Implications for Traders

For traders, recognising a Dead Cat Bounce is crucial to avoid entering positions based on false signals. Mistaking a temporary rally for an actual reversal can lead to significant losses. Therefore, it's essential to confirm the sustainability of a price increase through comprehensive analysis before making trading decisions.
Day traders may find opportunities to profit from the volatility associated with Dead Cat Bounces. By closely monitoring price movements and employing strict risk management strategies, they can capitalise on short-term gains. However, this approach requires experience and a deep understanding of market dynamics.
Long-term investors should exercise caution during such patterns. Rather than reacting to short-term price movements, they should focus on the fundamental health of the asset and broader market conditions. Diversification and a long-term investment horizon can help mitigate the risks associated with temporary market fluctuations.
Real-World Examples
Throughout financial history, several instances exemplify the Dead Cat Bounce phenomenon. For example, during the 2000 dot-com bubble burst, technology stocks experienced brief recoveries amidst a prolonged decline.
Similarly, in the 2008 financial crisis, markets saw temporary rallies before continuing their downward trajectory. These cases highlight the importance of analysing broader market conditions and not relying solely on short-term price movements.
Differentiating Between a Dead Cat Bounce and a Reversal
Distinguishing a Dead Cat Bounce from a genuine market reversal involves analysing various factors:
Volume: An actual reversal often accompanies increasing volume, indicating strong buying interest. In contrast, a Dead Cat Bounce typically occurs at a lower volume.
Fundamentals: Improvements in the asset's underlying fundamentals, such as earnings growth or positive industry trends, support a sustained recovery. Absent these factors, a price increase may be short-lived.
Technical Indicators: Breakouts above key resistance levels and confirmation from momentum indicators can signal a genuine reversal. Failure to surpass these levels suggests the rally may be temporary.
Conclusion
In conclusion, the Dead Cat Bounce is a critical pattern for traders to understand the potential for deceptive price movements following significant declines. By recognising the pattern's characteristics and causes, traders can make informed decisions, avoid common pitfalls, and develop strategies that align with their investment objectives.
Whether navigating short-term volatility or maintaining a long-term investment approach, awareness of the Dead Cat Bounce can enhance trading effectiveness and risk management.
Disclaimer: This material is for general information purposes only and is not intended as (and should not be considered to be) financial, investment or other advice on which reliance should be placed. No opinion given in the material constitutes a recommendation by EBC or the author that any particular investment, security, transaction or investment strategy is suitable for any specific person.


