Published on: 2025-03-06


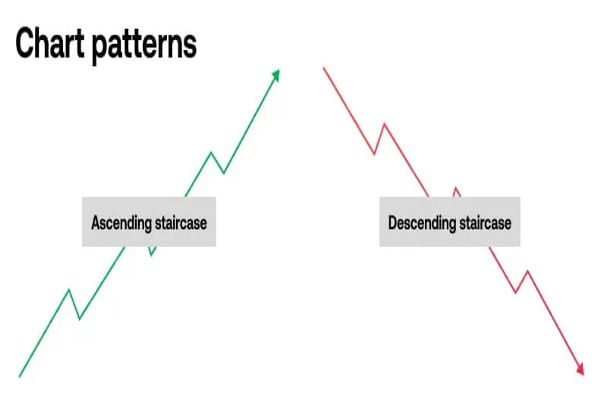
A bull flag pattern is a common chart formation employed in technical analysis, signifying a potential continuation of an asset's upward price movement. This pattern is characterised by a sharp upward price movement, followed by a brief consolidation phase, and then a breakout above the consolidation range. Key characteristics include a strong initial upward surge, a consolidation phase with a slight downward slope, and a breakout above the consolidation range. A bull flag forms during an uptrend, serving as a consolidation pattern that typically occurs after a significant price increase. It is a popular chart pattern used by traders to signal when the market is likely to rally further. The pattern usually appears when prices undergo a short-term corrective phase within a broader uptrend and is a reliable and consistent technical pattern that can be found on various chart periods.
The bullish flag pattern is a technical chart pattern that consists of three main components: the flag pole, the flag, and the breakout. The flag pole shows a strong directional trend, the flag is a period of consolidation, and the break of the price channel is a clear breakout structure. The flag pole is the initial part of the pattern and represents a strong, sharp, and usually vertical upward price movement. The flag is a period of consolidation or sideways movement, which forms the flag. The key characteristics to look for when identifying a bull flag pattern include the presence of a flag pole with a clear upward movement, followed by the flag's consolidation phase.
The bull flag pattern consists of three main components: the flag pole, the flag, and the breakout. The flag pole represents a strong, sharp upward price movement, often characterised by large green candles. This initial surge sets the stage for the pattern. Following the flag pole, the flag forms as a period of consolidation or slight retracement, typically taking the shape of a downward-sloping channel or rectangle. This phase indicates a temporary pause in the prevailing trend, allowing traders to catch their breath. Finally, the breakout occurs when the price breaks above the upper boundary of the flag, signalling a continuation of the bullish trend. Understanding these components is crucial for traders to identify and trade the bull flag pattern effectively.
The bull flag pattern is easily recognised by the large green candles that form a flag pole. The flag pole is formed by at least one, but sometimes several large green candles. The flag portion of the bull flag pattern is formed as the stock begins to pull back. The pattern can occur on any time frame, but is primarily traded on 5-minute and 1-minute stock charts. The flag pattern occurs when a trending price pauses and goes back over slightly in a rectangular range. Recognising Chart Patterns like the bull flag is crucial for traders to make informed decisions.
Trading a bull flag pattern involves a structured approach that combines technical analysis, risk management, and trade execution. First, ensure that you correctly identify the bull flag pattern on the price chart. Use additional technical analysis tools and indicators to confirm the pattern. Determine your entry point and set a stop-loss order below the lower boundary of the flag. Bull flag patterns fail if the flag corrects more than 50% of the flagpole's advance, making it crucial to select high-quality stocks for day trading. Use technical analysis techniques to estimate a potential price target for the trade. Wait for the price to rise above the flag's upper Trend Line and enter your trade when the price rises above the flag upper trend line. Once resistance breaks, place a buy order after the price retests that trend line.
Trading bull flag patterns requires a structured approach that combines technical analysis, risk management, and trade execution. One effective strategy is to identify the bull flag pattern on the price chart and confirm it using additional technical indicators such as moving averages or volume analysis. Once confirmed, traders should set their entry point just above the upper boundary of the flag, ensuring they enter the trade as the price breaks out. It's essential to place a stop-loss order below the lower boundary of the flag to manage risk. Setting a price target involves measuring the height of the flag pole and projecting it from the breakout point. This method helps traders estimate potential profit levels. By following these steps, traders can increase their chances of success when trading bull flag patterns.

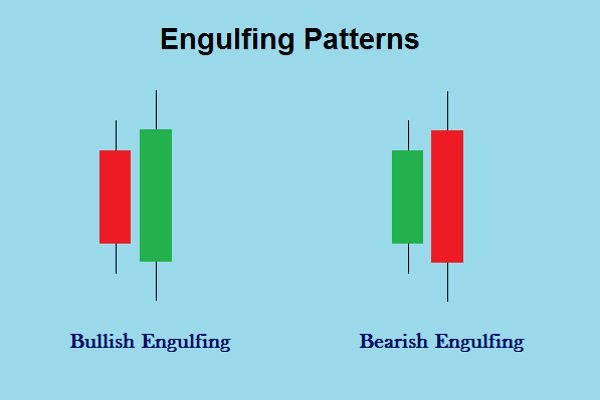
A bull flag is a bullish chart pattern that forms within an uptrend, while a bear flag is a bearish pattern that forms within a downtrend. Both signal consolidation for a market that generally results in a continuation of the underlying trend. Bear flag patterns signal bearish momentum during a downtrend, following a sharp decline and then a slight upward consolidation. The Bear Flag Pattern is a bearish continuation pattern, whereas the bull flag is a bullish continuation pattern.
The bull flag pattern offers several advantages for traders, including a clear signal of a continuation of the uptrend, a high probability of success, and a well-defined Risk-Reward Ratio. Bullish flags are advantageous due to their clear signal of a continuation of the uptrend and high probability of success. However, the bull flag pattern is not without fault, and some disadvantages include a high risk of false breakouts, a limited number of trading opportunities, and a potential for Overtrading. The bull flag pattern can fail if the company has an upcoming news event, such as a quarterly or annual earnings report.

A common mistake involves initiating trades when the flag's retracement is excessively deep. Overlooking volume dynamics is another error; a notable decrease in volume during the flag formation, followed by a significant upward spike on the breakout, illustrates buyers are still interested. Traders should also be aware of the Bullish Pennant pattern, which suggests tighter consolidation and typically occurs with less volume before a potential breakout. Properly setting stop-loss orders is important to managing risk. Patterns are easiest to find in retrospect, as you can easily see the pattern's future confirmation, unlike during live trading.
The Psychology Behind the Bull Flag
The bull flag chart pattern reflects the psychology behind the bullish market sentiment. It begins with a sharp price increase, forming the flag pole and indicating a strong bullish response from traders who drive the price up. The flag pattern in trading provides an opportunity for those looking to enter long (buy) positions.
Reliability and Frequency of Bull Flags
The reliability of the bull flag pattern depends on a few factors, including an increase in volume during the breakout and entering the trade as close to the point of breakout as possible. Bull flags, and their cousin the bull pennant, tend to occur frequently in markets experiencing strong uptrends. The bull flag pattern is a frequent occurrence in the price action of all securities and can aid any trader who missed out on the initial move.
Trading Bull Flags with Volume Confirmations
Volume plays an important role in identifying reliable bull flag patterns and distinguishing them from potential false breakouts. The price rally that forms the flag pole is accompanied by high trading volume, reflecting strong buying pressure. As the pattern develops, there's often a noticeable decrease in volume during the flag's formation, right after the flag pole.
Bear Flags: A Contrarian View
A bear flag pattern is identical to a bull flag pattern except the trend will be to the downside. The bearish flag pattern, characterised by a flag pole and continuation being equal distances, creates a channel that offers an accurately measured objective for traders. The key to trading flag patterns is following the volume. When volume comes in on the breakout, you want to be jumping on board.
Bull Flag Patterns That Fail
Bull flag patterns are more susceptible to failure when the flag corrects more than 50% of the flagpole's advance. A failed bull flag pattern occurs when prices fail to produce the expected outcome of generating a measured move break higher.
Breakout Pattern Strategies
Several bull flag trading strategies have been commonly traded, including breakout above flag resistance, retest horizontal break, and anticipating the end of the flag. Trade a breakout above flag resistance by waiting for the price to surpass the descending upper trendline of the flag. Ensure the breakout is supported by increased volume for pattern confirmation. Set a profit target by measuring the flagpole's height and extending this distance from the breakout level.
Bull flag patterns can occur in various market conditions, including trending markets, ranging markets, and volatile markets. In trending markets, bull flags are more reliable as they indicate a continuation of the prevailing trend. Traders should look for strong flag poles and well-defined flags in these conditions. In ranging markets, bull flags may be less frequent, but they can still provide profitable opportunities if identified correctly. Traders should be cautious and confirm the pattern with additional indicators. In volatile markets, bull flags can form quickly, and breakouts may be more aggressive. It's crucial to use tight stop-loss orders and be prepared for rapid price movements. By understanding how bull flag patterns behave in different market conditions, traders can adjust their strategies accordingly and improve their trading outcomes.
The bull flag pattern is a reliable and consistent technical chart pattern that can be used to trade for massive profits. By understanding the anatomy of the bull flag pattern and using trading strategies such as long entry, stop loss, and price target, traders can increase their chances of success. Additionally, traders should be aware of the different market conditions in which bull flag patterns can occur and adjust their trading strategies accordingly. Whether in trending, ranging, or volatile markets, the bull flag pattern remains a valuable tool for traders looking to capitalise on bullish continuation patterns.
Disclaimer: This material is for general information purposes only and is not intended as (and should not be considered to be) financial, investment or other advice on which reliance should be placed. No opinion given in the material constitutes a recommendation by EBC or the author that any particular investment, security, transaction or investment strategy is suitable for any specific person.