Year-to-date (YTD) is a fundamental concept in finance and business, representing the period from the beginning of the current year up to the present day.
Whether referring to a calendar year starting on January 1 or a fiscal year with a different start date, YTD is instrumental in tracking performance, analysing trends, and making informed decisions across various domains.
What Does YTD Mean in Finance?

YTD represents the period from the first day of the current calendar or fiscal year to the present. It is commonly used in financial statements, pay stubs, and investment reports to provide a snapshot of performance over this specific timeframe.
For employees, YTD earnings on a pay stub indicate the total income earned from the beginning of the year to the current pay period. This figure is crucial for budgeting, tax planning, and understanding overall compensation. It encompasses all forms of income, including base salary, bonuses, and commissions, providing a comprehensive view of earnings.
For instance, if you're reviewing your earnings on April 23, 2025, the YTD figure would encompass all income earned from January 1, 2025, through April 23, 2025.
Moreover, investors and financial analysts rely on YTD calculations to gauge the performance of investments and portfolios. By analysing YTD returns, they can determine how an asset has performed since the start of the year, aiding in investment decisions and portfolio rebalancing. For example, if a stock has increased from $100 to $110 since January 1, the YTD return would be 10%, indicating a positive performance.
How to Calculate YTD
The calculation of YTD is straightforward. It involves summing all relevant data points from the start of the year to the current date. For example, to calculate YTD earnings, you would sum all income from January 1 to today.
Similarly, for YTD sales, you would total all sales figures within the same period. This approach provides a cumulative view of performance, allowing for easy comparison against previous years or projected goals.
However, it's important to note that YTD can refer to either the calendar year or a fiscal year, depending on the context. While the calendar year begins on January 1, a fiscal year might start on a different date, such as April 1 or July 1, depending on the organisation's accounting practices. Understanding the specific time frame is essential for accurate analysis and comparison.
Real-World Examples
1. Stock Market Performance
Imagine an investor who owns shares of Apple Inc. On January 1, the stock price was $180. By April 22, 2025, the stock has risen to $198. To calculate the YTD return:
YTD Return = ((198 - 180) / 180) × 100 = 10%
It tells the investor that Apple's stock has gained 10% in 2025. If another stock in the portfolio has a YTD return of -4%, the investor may consider reallocating funds based on performance and expectations for the remainder of the year.
2. Business Revenue Tracking
A retail business tracks its monthly revenue. By the end of March 2025, the store has generated:
January: $45,000
February: $50,000
March: $60,000
The YTD revenue by the end of Q1 is $155,000. It helps the business evaluate its performance against a Q1 goal (say $150,000), revealing that it's slightly ahead. This insight helps plan inventory, staffing, and marketing strategies for Q2 and beyond.
3. Government Economic Reports
Governments often publish YTD statistics on tax collections, exports, or unemployment claims.
For instance, the U.S. Treasury might report that YTD federal tax receipts as of March are $1.2 trillion, compared to $1.1 trillion at the same point last year. It helps policymakers evaluate economic trends and fiscal health.
YTD vs. Other Time-Based Metrics

While YTD provides a year-long perspective, it's vital to distinguish it from other time-based metrics:
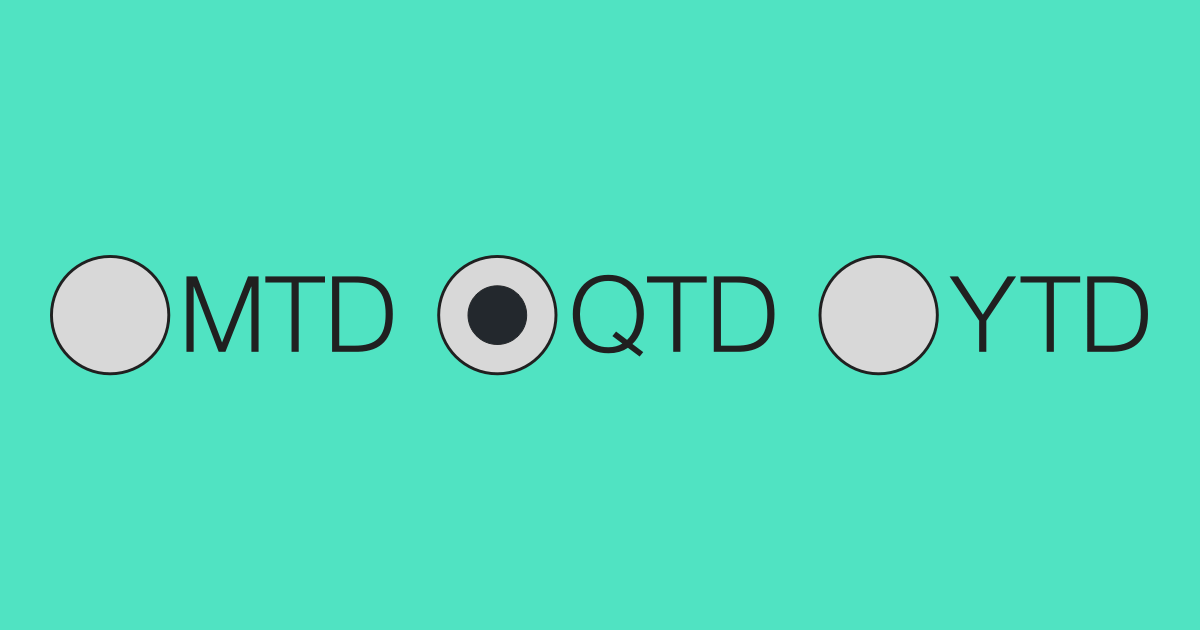
Month-to-Date (MTD): Measures performance from the beginning of the current month to the present date.
Quarter-to-Date (QTD): Covers the period from the start of the current quarter to the current date.
Year-over-Year (YoY): Compares performance between the same periods in different years, such as comparing Q1 2025 to Q1 2024.
Each of these metrics offers unique insights, and their usage depends on the specific analysis or comparison being conducted.
Limitations of YTD Analysis
While YTD is a valuable tool, it has limitations. Early in the year, YTD figures may not provide a complete picture due to the limited data available. Additionally, YTD does not account for seasonal variations or irregular events that can impact performance.
Therefore, it's essential to consider YTD data in conjunction with other metrics and contextual information to make well-rounded assessments.
Conclusion
In conclusion, year-to-date is a versatile and essential tool in financial analysis, offering insights into performance over a defined period. Whether used in business operations, investment analysis, or personal finance, YTD provides a clear picture of progress and helps inform strategic decisions.
By regularly monitoring YTD figures, individuals and organisations can stay aligned with their goals and respond effectively to changing circumstances.
Disclaimer: This material is for general information purposes only and is not intended as (and should not be considered to be) financial, investment or other advice on which reliance should be placed. No opinion given in the material constitutes a recommendation by EBC or the author that any particular investment, security, transaction or investment strategy is suitable for any specific person.


