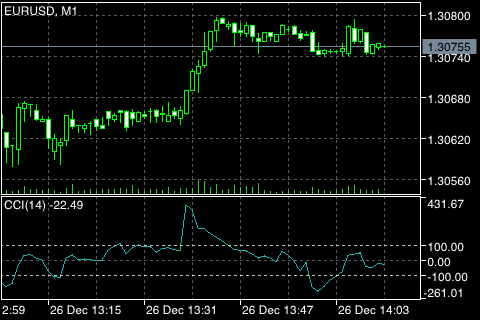
The Commodity Channel Index (CCI) is a technical indicator designed by Donald Lambert to measure the current asset price level relative to the average price level over a given time period. Originally created to identify cyclical changes in commodities, CCI indicators classify as momentum indicators, making them useful for identifying overbought and oversold levels.
The CCI measures the deviation between commodity prices and their average statistical prices, with high values indicating prices higher than the average and low values indicating prices lower than the average. It serves as a versatile financial measurement tool beyond commodities.
According to CCI's design assumption, the random fluctuation range of CCI should typically be between +100% and -100% in the C-domain (Chaind) Medium. Fluctuations exceeding these thresholds are considered non-random, potentially triggering interest from traders. When the CCI rises above +100%, it suggests a long position, while dropping below -100% suggests a short position.
Selecting parameters for CCI usage involves finding the most effective parameter "n." Typically, traders select parameters based on their historical performance, considering past records of profits and losses over a certain period.

The CCI fluctuates above and below the zero level, with fluctuations indicating overbought and oversold levels. Buy signals occur when the CCI moves above +100, suggesting a strong upward trend, while sell signals occur when it drops below -100, indicating a strong downward trend.
Two basic techniques for using CCI include identifying deviations and using it as an indicator of excessive buying and selling. When deviations occur, the CCI will not exceed the previous maximum value, typically during price corrections. Overbought and oversold conditions are indicated by CCI values above +100 and below -100, respectively, suggesting potential reversals in trends.
When trading based on CCI signals, it's essential to consider closing positions when the CCI crosses certain thresholds, such as +75 or -75, depending on the direction of the trade.
【 EBC Platform Risk Reminder and Disclaimer 】: There are risks in the market, and investment needs to be cautious. This article does not constitute investment advice.


