Forex traders need market volatility in order to profit from price fluctuations. If there were no market fluctuations, there would be no price fluctuations and no way to make money - especially once commissions and spreads are taken into account.

Stock traders can rely on VIX (Volatility Index compiled by Chicago Options Traders), but the forex market does not have such comparable indicators.
Volatility indicators are very useful when deciding when to trade, what market to trade in, and what strategies to use.
Of course, spreads and commissions are determined by the volatility of a certain financial instrument, but in any case, mastering methods to measure market volatility is of great benefit to traders.
Average True Amplitude (ATR)
ATR measures the difference between the highest and lowest prices, between the highest and closing prices, or between the lowest and closing prices. The highest absolute value of these three calculated results is used as the ATR value.
So, measuring volatility with ATR is very simple. Usually, a value of 14 days is taken. When ATR decreases for a long period of time, the market usually experiences significant fluctuations.
Standard Deviation
The standard deviation measures the difference between the closing price and the average price over a period of time. It is another simple volatility indicator, but due to its statistical background, it can be used to test more objective rules. Usually, when the standard deviation reaches its peak, the currency pair will begin to reverse its trend.
Boll
The Bollinger line also uses standard deviation. In fact, each line is a standard deviation line that moves above and below the mean line. Technicians typically use settings of 20,2,2. That is, the 20 day Moving Average, the upper trajectories (2 times the standard deviation higher than the moving average), and the lower trajectories (2 times the standard deviation lower than the moving average).
Bollinger lines can effectively display market volatility as they always follow changes in market conditions. When market volatility decreases, the upper and lower trajectories of the Bollinger Line gradually converge, indicating that a breakthrough market is about to occur.
Jiaqing Index
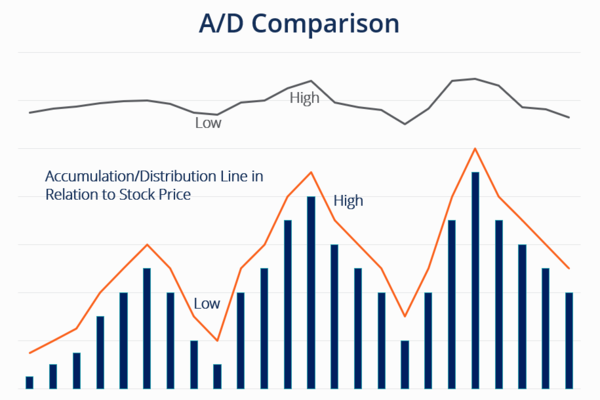
The Jiaqing indicator is different from other aforementioned indicators in that it compares the differences between two moving averages and uses a volume weighted distribution line.
This means that volatility is constantly being redefined. This is beneficial for short-term traders as this indicator determines the top of volatility multiple times a day.
【 EBC Platform Risk Reminder and Disclaimer 】: There are risks in the market, and investment needs to be cautious. This article does not constitute investment advice.


