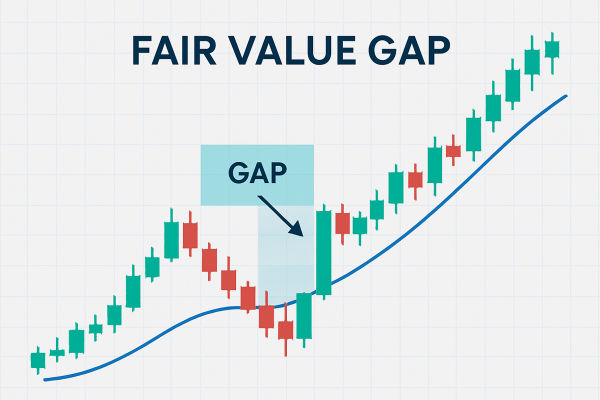
In technical analysis, candlestick patterns are vital tools for traders aiming to predict market movements. Among these, the bullish harami stands out as a significant indicator of potential trend reversals.
While not as well-known as the morning star pattern, doji or others, the pattern serves as a potential indicator of a trend reversal from bearish to bullish.
Understanding the Bullish Harami Pattern
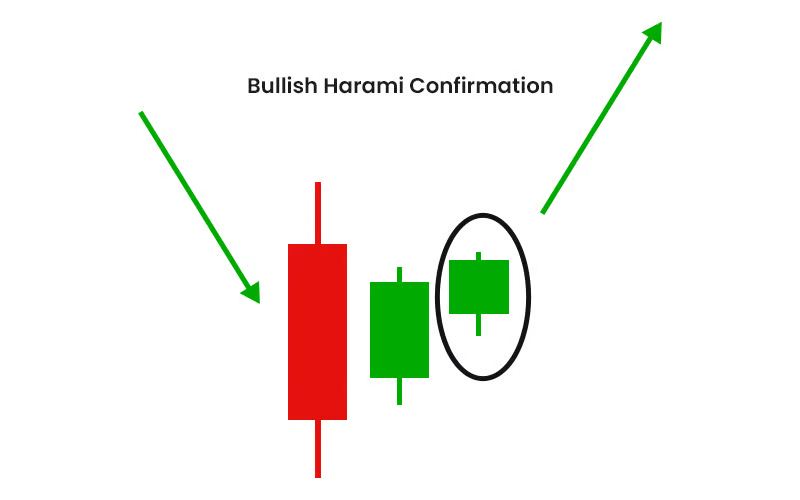
The term "harami" originates from Japanese, meaning "pregnant," aptly describing the pattern's appearance. A bullish harami is a two-candlestick pattern that signals a potential reversal from a downtrend to an uptrend.
It comprises a large bearish candlestick followed by a smaller bullish candlestick, where the second candle's body is entirely contained within the first candle's body. This formation suggests a shift in market sentiment, indicating that selling pressure may be diminishing and buyers could be gaining control.
Formation and Identification
To identify a bullish harami, traders look for the following characteristics:
First Candle: A long and bearish candlestick that reflects a significant price decline, indicating strong selling pressure.
Second Candle: A smaller bullish candlestick that opens and closes within the first candle's body, signifying a potential pause or reversal in the prevailing downtrend.
The key aspect of this pattern is the containment of the second candle within the first, symbolising a potential shift in momentum from sellers to buyers.
Psychological Interpretation
The bullish harami pattern reflects a change in market sentiment. The initial large bearish candle indicates strong selling interest, pushing prices lower.
However, the subsequent smaller bullish candle suggests that the selling pressure is waning, and buyers are beginning to emerge. This shift can be attributed to various factors, such as profit-taking by short sellers or new buyers entering the market, anticipating a potential reversal.
Trading Strategies
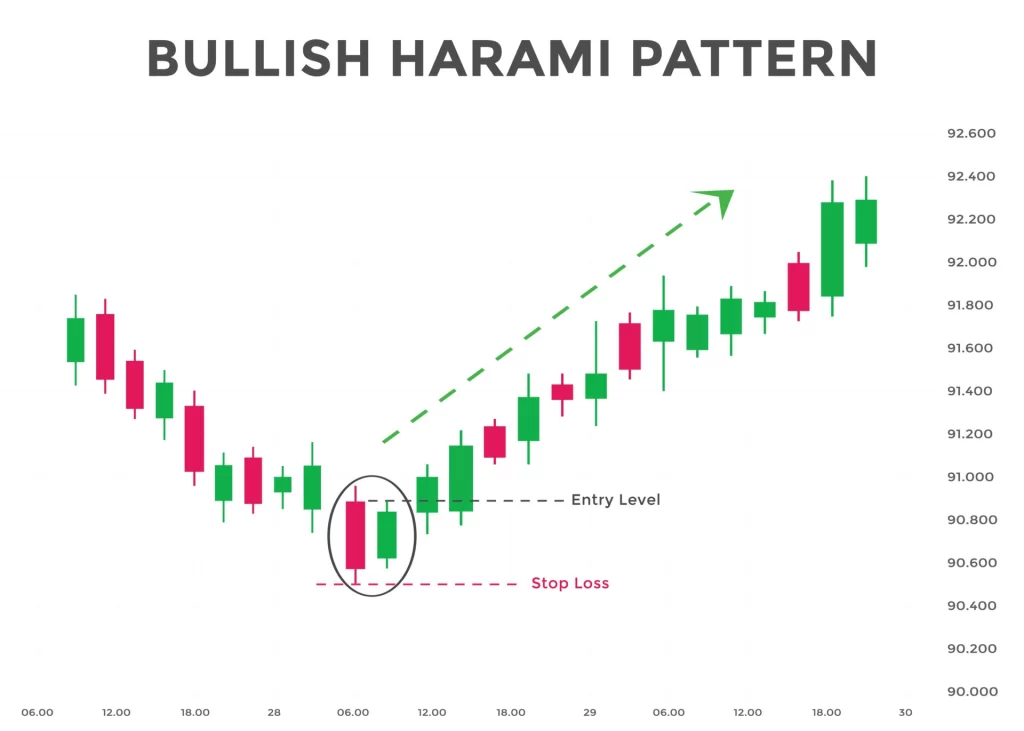
To use the bullish harami effectively, traders often build structured strategies around pattern recognition, confirmation signals, and proper risk management. Although the pattern may suggest a bullish reversal, acting on it without a thoughtful approach can be risky.
A good strategy begins with identifying a prevailing downtrend. The bullish harami is considered significant only when it appears after a clearly defined bearish trend. The larger and more consistent the downtrend, the better the potential reversal signalled by the harami pattern.
Once the pattern is identified, many traders look for confirmation in the next trading session. Confirmation could come in the form of a strong bullish candlestick that closes above the high of the second candle in the harami pattern. Some traders may wait for a breakout above a nearby resistance level before entering a trade. Others may enter more aggressively after the pattern forms, specifically if supported by increased volume or bullish signals from other indicators.
Volume analysis plays a key role. A bullish harami accompanied by high volume on the second day adds weight to the signal, suggesting increased interest from buyers. Technical indicators like RSI (Relative Strength Index), MACD (Moving Average Convergence Divergence), or Stochastic Oscillators can also help. If RSI is below 30 and turning up, for instance, this oversold signal with a bullish harami can increase confidence in a potential upside reversal.
Stop-loss placement is another critical component of a harami-based strategy. Many traders set their stop-loss orders just below the low of the bearish candle in the pattern. It acts as a logical support level. If the price dips below that low, it suggests the pattern has failed, and the downtrend may continue.
Benefits to Know
One of the massive benefits of the bullish harami is its simplicity. Even beginner traders can recognise it with a bit of practice. It requires no complex calculations or software. The visual nature of candlestick charts makes spotting the pattern intuitive, especially for those using platforms with candlestick charting capabilities.
The bullish harami is also valuable because it provides early signals. While some reversal patterns require several candles to form, the harami offers a potential alert within just two trading periods. This quick signal allows traders to anticipate market shifts sooner than other indicators.
Another advantage is its effectiveness when combined with other forms of analysis. For example, if a bullish harami forms near a long-term support level, it gains added credibility. Similarly, if the pattern appears alongside a positive divergence in momentum indicators or after a key economic announcement, it may carry more weight.
This pattern also works across different markets and timeframes. Whether you're trading stocks, forex, commodities, or cryptocurrencies, the bullish harami can be applied consistently. It can also be used on daily, weekly, or intraday charts, making it versatile for swing traders and day traders.
Because it is a reversal pattern, the bullish harami can help traders capitalise on early trend changes rather than chasing late-stage rallies. This allows for better entry points, tighter stop-loss levels, and higher risk-reward ratios. If the trend continues upward after confirmation, the early entry offered by the bullish harami can lead to substantial gains.
Risks to Consider
Despite its usefulness, the bullish harami pattern has several limitations that traders must be aware of. First and foremost, it is not always a strong standalone signal. The appearance of a bullish harami does not guarantee a trend reversal. In many cases, it can be followed by further downward movement, especially if the pattern forms in a weak or choppy market environment.
The pattern is also subject to interpretation. The size of the candlesticks, the exact location of the second candle's body, and the degree to which it is "contained" within the first candle can vary. It makes it somewhat subjective, and different traders may interpret the same chart differently. Without clear guidelines, inconsistent pattern recognition can lead to poor trade decisions.
Another limitation is that the bullish harami is less effective in strong trends. If the overall market or the individual asset is in a powerful downtrend driven by significant news or macroeconomic events, a single bullish harami is unlikely to halt that momentum. In such situations, the pattern can give a false sense of reversal when, in reality, it's just a brief pause before the trend continues.
The pattern's reliability also decreases without confirmation. Entering trades based solely on the two-candle formation without waiting for follow-up bullish price action often results in premature entries and losses. Volume confirmation or third-candle validation is essential but not always available or easy to interpret.
Additionally, market noise can lead to the frequent appearance of patterns that resemble a bullish harami but do not result in meaningful reversals. This "pattern clutter" is normal in lower timeframes, where price action can be erratic. Traders relying solely on candlestick patterns without considering the broader trend may fall into this trap.
Lastly, the pattern does not indicate how far the reversal might go. While it suggests a potential trend shift, it provides no guidance on the strength or duration of the new trend. For this reason, traders often need to pair it with trend-following tools to gauge the possible upside or to know when to exit the trade.
Conclusion
In conclusion, the bullish harami is a valuable candlestick pattern for traders seeking to identify potential reversals in a downtrend. By understanding its formation, psychological implications, and how to incorporate it into a broader trading strategy, traders will make more informed decisions.
However, like all technical indicators, it should not be used in isolation but rather as part of a comprehensive analysis approach.
Disclaimer: This material is for general information purposes only and is not intended as (and should not be considered to be) financial, investment or other advice on which reliance should be placed. No opinion given in the material constitutes a recommendation by EBC or the author that any particular investment, security, transaction or investment strategy is suitable for any specific person.


