Published on: 2023-06-27
Updated on: 2024-07-05
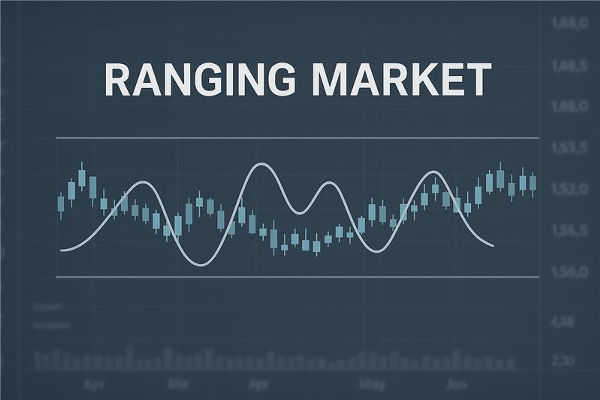
Oscillatory Trading refers to trading activities that occur when financial market prices are relatively stable and fluctuate within a certain range. In oscillatory markets, prices often fluctuate repeatedly between support and resistance levels, lacking a clear trend direction. Oscillatory Trading focuses on utilizing the volatility of prices within this range to buy and sell in order to earn short-term profits.

A oscillatory market usually occurs when there is a lack of clear market drivers or when the market is in a consolidation stage. In this market environment, the rise and fall of prices will not last for too long but will fluctuate back and forth between certain support and resistance levels. Oscillatory traders judge entry and exit opportunities by observing the characteristics of price fluctuations, technical indicators, and market trends in order to capture opportunities for price fluctuations.
This type of trading strategy can be applied to stocks, forex, futures, and other trading varieties. When conducting oscillatory trading, traders usually set smaller profit targets and stricter stop-loss positions to control risk and limit losses. At the same time, oscillatory markets also require traders to have sharper market observation and the ability to make quick decisions in order to fully seize rapidly changing trading opportunities.
The volatility trading strategy is a trading method suitable for markets in oscillatory conditions (where prices fluctuate within a certain range). Oscillatory markets typically lack clear trends, and prices fluctuate between support and resistance levels. The goal of a oscillatory trading strategy is to buy and sell within the range of price fluctuations to capture short-term fluctuations in prices.
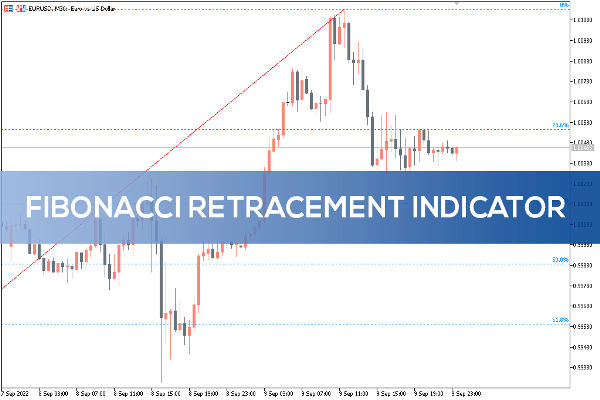
Determine the timing of buying and selling by observing the rebound and retreat of prices between the support level (the level of resistance below the price) and the resistance level (the level of resistance above the price).
Determine the timing of buying and selling by observing the intersection and post-intersection movements of prices below the moving average. When prices fluctuate near the moving average, intersections may provide trading opportunities.
For example, relative strength indicators (RSI) and stochastic indicators (Stochastic Oscillator) determine the timing of buying and selling by observing the situation of overbought and oversold prices.
Look for clear upper and lower limits on the price that have formed over a period of time; sell when the price approaches the upper limit, and buy when the price approaches the lower limit.
Observe the rebound and fall of prices near the upward or downward Trend Line to determine the timing of buying and selling.
Regardless of the volatility trading strategy used, traders need to closely monitor market volatility and price changes to accurately grasp the timing of buying and selling. In addition, risk management is also crucial, including setting stop-loss and stop-gain positions to limit potential losses. It is best to fully understand and test any trading strategy before using it to ensure that it is suitable for an individual's trading style and risk tolerance.


World's Best Broker