Published on: 2025-07-02

Reversal candlestick patterns are powerful tools in technical analysis, helping traders identify potential shifts in market trends. These patterns indicate that a prevailing trend, whether bullish or bearish, may be nearing its end, suggesting that a change in direction is likely. By recognising these patterns, traders can position themselves to capitalise on price movements before the trend fully reverses.
Candlestick charts, the foundation for reversal candlestick patterns, display individual candlesticks that represent price movements over specific time intervals. Each candlestick has a body and wicks or shadows extending from the top and bottom, which represent the price range for that period. The body shows the difference between the opening and closing prices, while the wicks indicate the high and low points.
When reversal candlestick patterns form, they typically appear after a significant price movement in one direction, suggesting that the trend may have run its course. These patterns are formed when market participants become uncertain, and buying or selling pressure diminishes. This change in momentum often signals the possibility of a price reversal, giving traders an opportunity to enter a position before the new trend begins.

At its core, reversal candlestick patterns are visual cues on price charts that help traders identify potential turning points in the market. These patterns suggest that a trend is losing steam, and a change in direction could soon occur. Recognising these patterns at the right time allows traders to adjust their strategy and take advantage of price shifts before they fully materialise.
For example, a key feature of reversal candlestick patterns is that they often form after an extended uptrend or downtrend, indicating that the market's momentum may be coming to an end. As the price struggles to continue moving in the same direction, a reversal candlestick pattern may form, indicating that buyers or sellers have lost control, and the market is likely to reverse course.
The most effective reversal candlestick patterns occur in well-established trends, where the market is showing clear signs of exhaustion. Once these patterns are recognised, they provide traders with a timely signal to enter a trade, potentially capturing profits as the trend changes direction.

1) Doji
One of the most well-known reversal candlestick patterns is the Doji. The Doji pattern signifies indecision in the market and forms when the opening and closing prices are nearly the same. This creates a candlestick with a very small body and long wicks.
A Doji after a prolonged uptrend or downtrend can signal that the current trend is losing strength and may be ready to reverse. When a Doji appears, traders often interpret it as a potential signal for a market reversal, especially if it is confirmed by subsequent price action.
2) Hammer
Another well-known pattern is the Hammer, which appears after a downtrend and indicates a potential bullish reversal. The Hammer has a small body near the top of the candlestick with a long lower wick.
This pattern suggests that buyers attempted to push prices higher, but sellers controlled the market initially, before buyers took over and pushed the price back up.
3) Hanging Man
The Hanging Man pattern, which is similar to the Hammer, occurs after an uptrend and may indicate a bearish reversal. The key difference is the location of the pattern within the trend: the Hammer suggests a potential reversal after a downtrend, while the Hanging Man signals a possible reversal after an uptrend.
4) Engulfing Pattern
Another pattern frequently seen is the Engulfing pattern. This pattern consists of two candlesticks, where the second candlestick fully engulfs the body of the first. A Bullish Engulfing pattern, in which a larger green candlestick follows a smaller red one, may indicate a shift from a downtrend to an uptrend.
On the other hand, a Bearish Engulfing pattern, where a large red candlestick follows a smaller green one, suggests that a bullish trend may be about to reverse into a bearish trend.
5) Morning Star and Evening Star
The Morning Star and Evening Star patterns are also considered powerful reversal signals. A Morning Star is a three-candle pattern that appears after a downtrend and consists of a large bearish candlestick, followed by a small-bodied candlestick (either bullish or bearish), and a long bullish candlestick.
The Evening Star, which is the opposite of the Morning Star, appears after an uptrend and consists of a large bullish candlestick, followed by a small-bodied candlestick, and then a long bearish candlestick. Both of these patterns suggest a shift in momentum, either from bearish to bullish or from bullish to bearish, depending on the pattern.
6) Shooting Star
The Shooting Star is another key reversal candlestick pattern, commonly seen after an uptrend. It features a small body with a long upper wick, indicating that buyers tried to push the price higher, but sellers took control by the close of the candlestick, pushing the price down.
This suggests that the market may be reversing direction from an uptrend to a downtrend.

While reversal candlestick patterns are incredibly valuable in predicting market movements, they should never be used in isolation. Combining these patterns with other technical indicators can significantly improve their effectiveness. For instance, traders may look for confirmation from trend indicators, such as moving averages or RSI (Relative Strength Index), to increase the reliability of the signal.
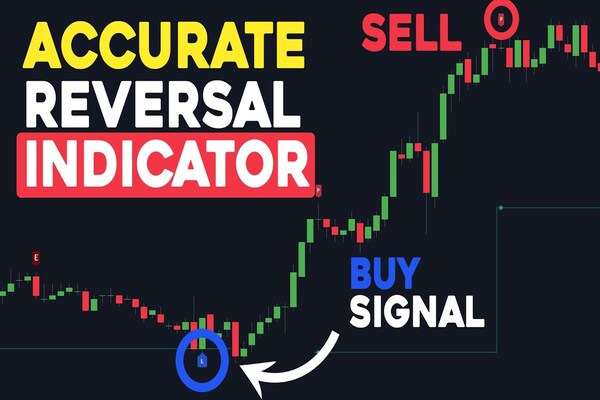
Traders can also use reversal candlestick patterns to identify key entry and exit points. For example, after a bullish reversal pattern like the Morning Star, traders may enter a long position when the price breaks above the high of the third candlestick in the pattern. Similarly, for bearish reversal patterns like the Evening Star, traders might consider entering a short position when the price breaks below the low of the third candlestick.
It's also important to consider the volume accompanying the pattern. Reversal candlestick patterns that occur with higher-than-average volume tend to be more reliable. A pattern accompanied by low volume may suggest a false signal, as it indicates a lack of conviction from market participants.
Incorporating reversal candlestick patterns into your trading strategy is a highly effective way to spot potential trend changes in the market. By recognising these patterns, traders can anticipate price shifts before they fully occur, giving them the opportunity to enter trades at the optimal time. However, it's essential to combine these patterns with other technical analysis tools and proper risk management techniques to increase the likelihood of success.
Whether you're a beginner or an experienced trader, understanding how to identify and use reversal candlestick patterns can significantly enhance your trading strategy. Always keep in mind that no single pattern is foolproof, but with experience and practice, these patterns can provide invaluable insights into market movements.
Disclaimer: This material is for general information purposes only and is not intended as (and should not be considered to be) financial, investment, or other advice on which reliance should be placed. No opinion given in the material constitutes a recommendation by EBC or the author that any particular investment, security, transaction, or investment strategy is suitable for any specific person.
World's Best Broker