As an investor, you're always looking for an edge—something that gives you a deeper understanding of where a stock is headed before the crowd catches on. The On-Balance Volume (OBV) Indicator offers just that, revealing the hidden forces driving price movements.
The OBV indicator lets you tap into the market's heartbeat, showing how buying or selling pressure is building over time. When it rises alongside price, it signals that the trend is strong and supported by solid volume. However, when it starts diverging from price, it's a red flag that the trend could be losing steam. Whether you're confirming a breakout or spotting a potential reversal, this indicator becomes an invaluable tool in making more informed, confident investment decisions.
What is OBV Indicator and What is it's Purpose
The OBV indicator is a cornerstone in the world of technical analysis, offering traders and analysts a unique perspective on market trends by combining price movement with trading volume. Developed by Joseph Granville in the 1960s, this indicator operates on a straightforward yet powerful premise: volume precedes price movement. Essentially, when volume increases without a corresponding price change, it suggests underlying strength or weakness in the market, foreshadowing potential price shifts.

Volume, in this context, serves as a measure of market activity and conviction. A rising OBV indicates that volume is flowing into an asset during upward price movements, signaling strong buying pressure. Conversely, a declining OBV suggests volume is leaving the asset during downward price movements, highlighting selling pressure. This dynamic relationship between price and volume makes the OBV indicator particularly useful for identifying the strength behind market trends and predicting potential reversals before they become evident in price action alone.
OBV Indicator's Calculation and Formula
At its core, the OBV indicator is calculated cumulatively, building a continuous line that reflects the net volume flow. The formula for OBV is as follows:
-
If today's closing price is higher than yesterday's closing price: OBV = Previous OBV + Today's Volume
-
If today's closing price is lower than yesterday's closing price: OBV = Previous OBV - Today's Volume
If today's closing price is unchanged: OBV = Previous OBV

This formula highlights how the OBV line responds to price changes. A rising OBV line indicates that buyers are actively accumulating positions, while a falling OBV suggests sellers are dominating the market. If the OBV line remains flat, it indicates a lack of significant buying or selling pressure.
For example, imagine a stock that closes higher with a daily volume of 1 million shares. The OBV would increase by 1 million. If the stock closes lower the next day with a volume of 500.000 shares, the OBV would decrease by 500.000. These cumulative changes form the OBV line, which traders use to spot trends, divergences, and reversals.
OBV Indicator's Role in Trading Strategies
Having explored the basic principles and formula behind the OBV Indicator, it's clear that its value lies in how it integrates volume and price movements to offer a more nuanced view of market trends. However, the true strength of OBV lies in how it can be used to gauge market sentiment and identify the underlying forces driving price changes. For traders, the indicator provides several key insights that can enhance decision-making.
One of the most common ways OBV is employed is for trend confirmation. When the price is rising and OBV is also trending upwards, it signals that the uptrend is supported by strong volume. This suggests that the price movement is likely to continue, as it is backed by significant buying pressure.
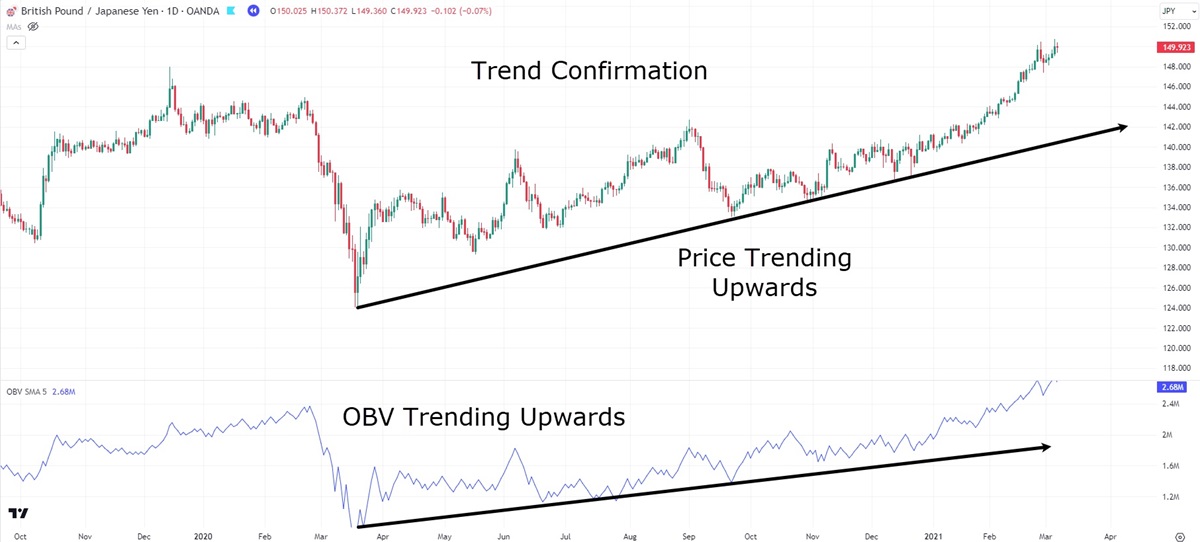
Conversely, when the price is falling and OBV follows suit, it reinforces the notion that selling activity is dominating the market, further confirming the downtrend. In both cases, OBV helps ensure that the trend is not just a short-term fluctuation but a sustained market movement.
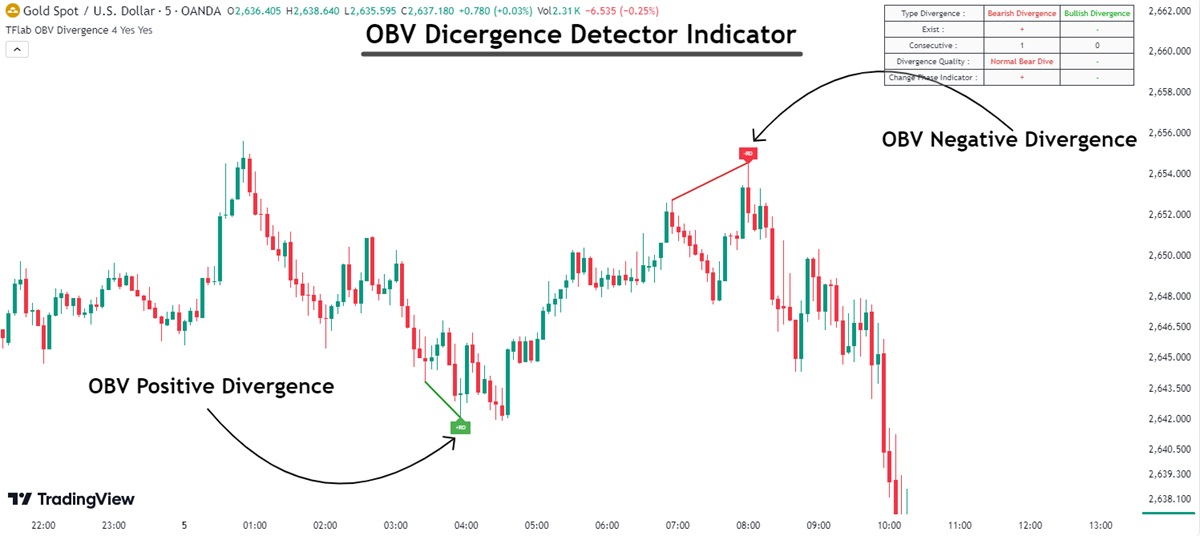
Another critical application of OBV is in spotting divergences between price and volume. A divergence occurs when the price is making new highs, but OBV is failing to follow suit, or vice versa. Such divergences can be early warning signals of a potential trend reversal.
For example, if a stock is climbing to new highs but OBV fails to make similar advances, it suggests that the volume supporting the price is weakening. This might indicate that the uptrend is running out of steam and a reversal could be on the horizon. Similarly, if prices are making new lows but OBV is rising, it suggests that there is increased buying pressure despite falling prices, potentially pointing to an impending bullish reversal.
Lastly, OBV can be used to confirm breakouts. When a security breaks through a key support or resistance level, a sudden increase in OBV can provide confirmation that the breakout is genuine, driven by real market interest rather than a temporary fluctuation. A surge in OBV at the time of a breakout signals that the market has the volume necessary to sustain the price move, offering traders a clearer indication of where the trend might head next.
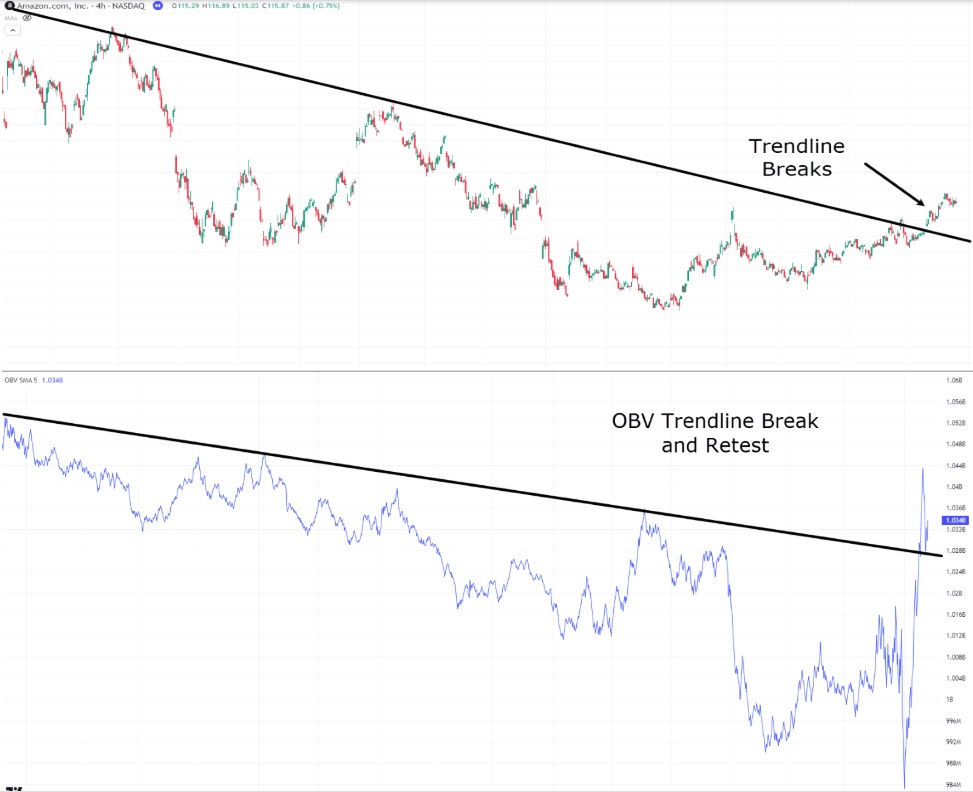
In the chart above, the downtrend in Amazon is emphasised by the breach of the trendline, which alone could suggest a potential shift in price dynamics, signaling the commencement of a new trend. However, to further substantiate this observation, we can look at the OBV chart, where the indicator responds directly to the recent break of the downtrend.
Notably, the surge in volume accompanying the trendline break signals heightened market activity during this critical juncture. Additionally, the volume tests the trendline again before experiencing a rebound, which reinforces the validity of the trend change.
When comparing these two charts side by side, the case for considering a technical buy on Amazon stock becomes more compelling. What are your thoughts? What do you think occurred after the trendline break?
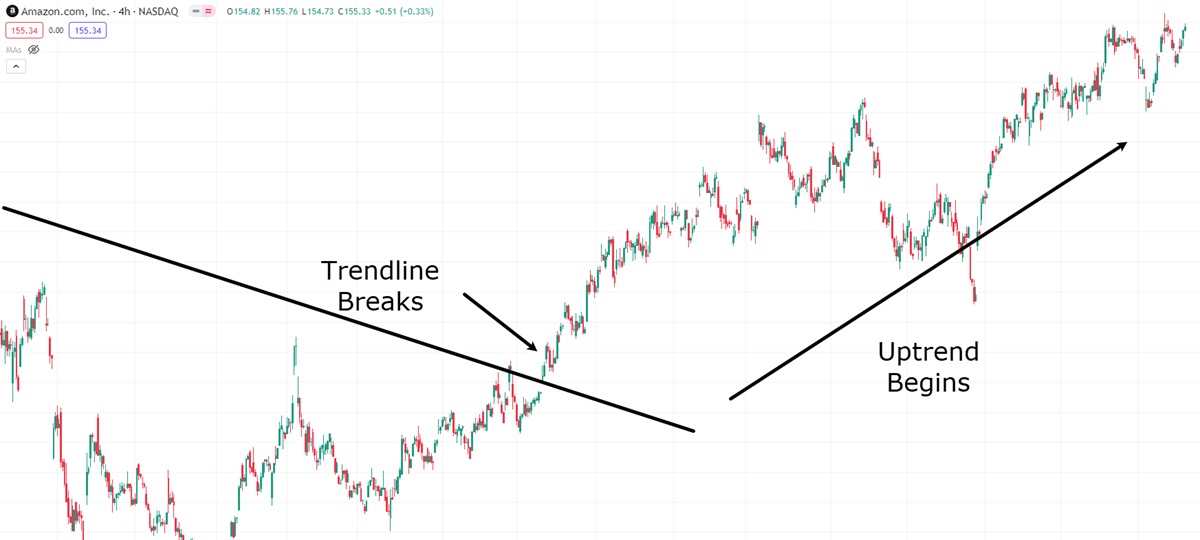
After the trend break, Amazon initiates a new upward movement on the price chart. Traders who entered the market based on the confirmation from the trend break, along with other key entry signals, would have effectively capitalised on Amazon's recent uptrend.
However, it's important to emphasise that, although a trend break provides strong confirmation, it may not always be sufficient as a single factor for making a trade decision.
OBV Indicator's Limitations and Considerations
Despite its usefulness, the OBV indicator is not without its limitations. Like all technical indicators, it is important to use OBV in conjunction with other tools to build a more complete picture of the market. One of the main drawbacks of OBV is that it does not offer much insight into the magnitude of price movements. While it can tell you if there is an increase in volume supporting a price trend, it does not necessarily provide any indication of how far or how fast the price will move.
Furthermore, OBV can sometimes give false signals, especially in sideways or range-bound markets. In such environments, OBV might show rising volume without any significant price movement, leading to potential misinterpretations. For instance, if a stock is stuck in a tight range, OBV could show increasing volume, but without a clear price trend, it may be difficult to discern whether the volume is supporting a future breakout or just reflecting normal market fluctuations.
Another potential limitation is that OBV is primarily a lagging indicator. While volume can precede price, OBV still depends on past price movements to update its cumulative total. As such, it may not always provide real-time insights in rapidly changing markets, where immediate reaction is needed.
For these reasons, many traders prefer to combine OBV with other indicators, such as moving averages, Relative Strength Index (RSI), or MACD, to confirm signals and avoid over-reliance on a single tool. By using OBV as part of a broader trading strategy, traders can gain more confidence in their decisions and better manage the risks associated with false signals.
OBV Indicator's Strengths and Limitations
| Strengths |
Limitations |
Confirm trends with volume
|
Lacks Insight into price movement size |
| Identifies potential reversals |
Can give false signals in volatile markets |
| Validates breakouts |
Less effective in range-bound markets |
In essence, the OBV Indicator is a valuable tool for traders seeking to understand the relationship between volume and price movements. By tracking the flow of volume, OBV can help confirm trends, highlight divergences, and validate breakouts.
While it is not without its limitations, its simplicity and effectiveness in providing early insights into market momentum make it a key part of many investors' strategies. As with all technical indicators, the best results come from using OBV alongside other tools to create a more comprehensive approach to market analysis. With the right understanding and application, OBV can provide a significant edge in navigating the complexities of the financial markets.
Disclaimer: This material is for general information purposes only and is not intended as (and should not be considered to be) financial, investment or other advice on which reliance should be placed. No opinion given in the material constitutes a recommendation by EBC or the author that any particular investment, security, transaction or investment strategy is suitable for any specific person.


