When it comes to reading candlestick charts, traders often look for specific patterns that signal potential market reversals. One of the most commonly recognised patterns is the engulfing candle. The question arises: is this pattern the most reliable reversal indicator available to traders?
In this article, we'll explore what the engulfing candle is, how to identify it, and whether it can be considered the most reliable pattern for spotting reversals.
What Is an Engulfing Candle?

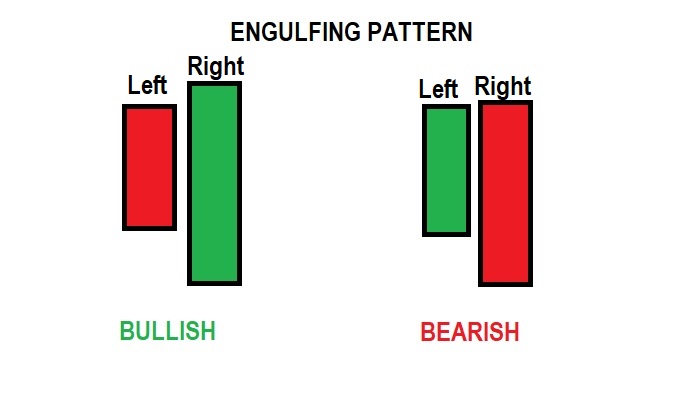
An engulfing candle is a two-candle pattern that suggests a potential reversal in market direction. It occurs when a smaller candle is followed by a larger one, where the body of the second candle completely engulfs the body of the first. There are two main types of engulfing candles: the bullish engulfing and the bearish engulfing.
Bullish Engulfing: This occurs when a small bearish candle is followed by a larger bullish candle, signalling a potential reversal from a downtrend to an uptrend.
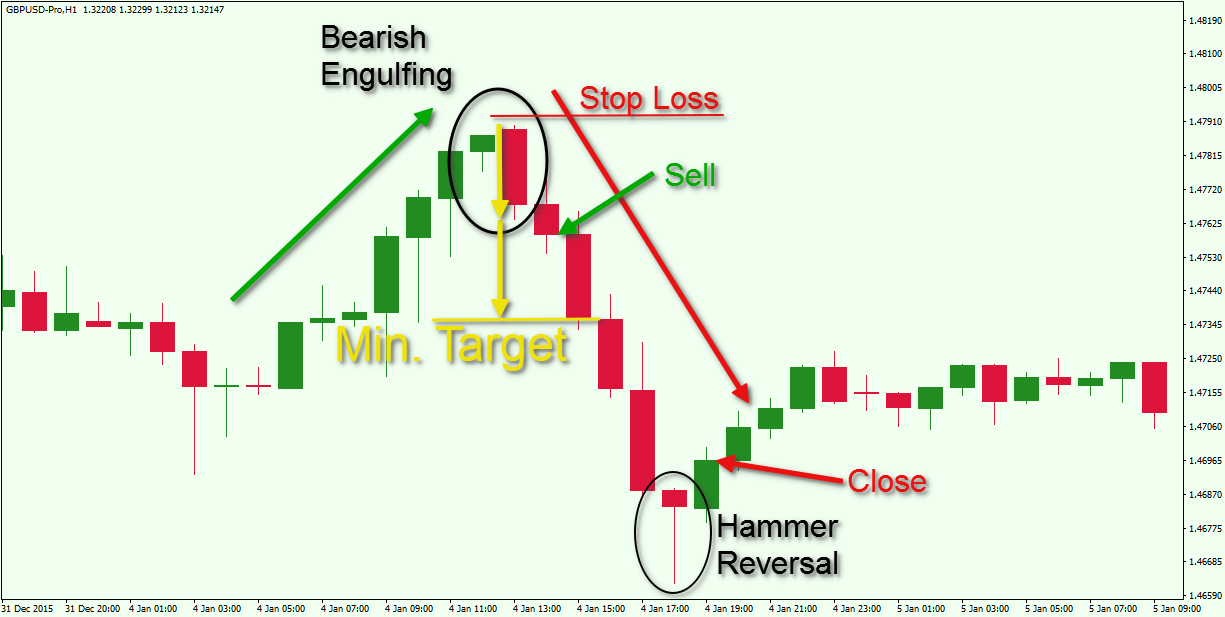
Bearish Engulfing: This happens when a small bullish candle is followed by a larger bearish candle, indicating a potential reversal from an uptrend to a downtrend.
The engulfing pattern is significant because it shows that there is a shift in momentum, with the second candle "overpowering" the first, which can be interpreted as a shift in market sentiment.
How to Identify an Engulfing Candle
Identifying an engulfing candle pattern is relatively straightforward once you understand the key characteristics. Here's what you need to look for:
Two Candles: The pattern consists of two candles — one smaller candle followed by a larger one.
Engulfing: The second candle completely engulfs the body of the first candle. This means the open and close of the second candle should be outside the open and close of the first.
Trend Direction: The engulfing candle typically forms after a prior trend, whether upward or downward, suggesting a potential reversal.
Bullish and Bearish Engulfing Patterns Explained
The significance of the engulfing candle pattern lies in the shift in momentum it signals. Here's a breakdown of both types:
Bullish Engulfing: A bullish engulfing pattern suggests that the market may be reversing from a downtrend to an uptrend. This is especially significant when the pattern forms at or near a support level, as it suggests that buyers are taking control.
Bearish Engulfing: Conversely, a bearish engulfing pattern suggests that the market may be reversing from an uptrend to a downtrend. This pattern is particularly powerful when it forms near resistance levels, indicating that sellers are taking over from buyers.
Is the Engulfing Candle the Most Reliable Reversal Pattern?
Now that we understand the basics of the engulfing candle pattern, let's address the question: is it the most reliable reversal pattern?
While the engulfing candle is certainly a popular and effective tool for spotting reversals, its reliability is not absolute. Like any technical pattern, the engulfing candle has its strengths and weaknesses. Let's take a closer look at both:
Strengths of the Engulfing Candle
Clear and Easy to Identify: The engulfing candle pattern is relatively easy to spot on charts, making it accessible for both beginner and experienced traders.
Strong Reversal Indication: The size of the second candle in the engulfing pattern suggests a clear shift in market sentiment, which can often signal a change in trend direction.
Works Well in Trending Markets: The engulfing candle is particularly effective when it forms after a prolonged trend, either upwards or downwards. It often indicates that the trend may be losing momentum and a reversal could be imminent.
Weaknesses of the Engulfing Candle
False Signals: Like all candlestick patterns, the engulfing candle is not foolproof. In choppy or sideways markets, the pattern can sometimes result in false signals.
Requires Confirmation: Traders often use other indicators to confirm the validity of the engulfing candle. For example, combining it with support and resistance levels, volume, or momentum indicators can improve its reliability.
Lack of Context: The engulfing candle alone may not provide enough information about the overall market condition. It's essential to consider the broader market trend and surrounding price action before acting on the signal.
Enhancing Your Strategy with the Engulfing Candle

To maximise the effectiveness of the engulfing candle pattern, it's often best to combine it with other tools and strategies. Here are a few ways to improve your trading strategy using engulfing candles:
Use Trend Indicators: Combining the engulfing candle with trend indicators, such as moving averages, can help you confirm the direction of the trend. A bullish engulfing pattern that appears when the price is above a moving average, for example, could be a stronger signal of an uptrend.
Look for Support and Resistance: The pattern is more reliable when it forms at key support or resistance levels. A bullish engulfing pattern at support or a bearish engulfing pattern at resistance increases the likelihood of a successful reversal.
Volume Confirmation: Higher volume during the formation of the engulfing candle can suggest that the reversal is more likely to be sustained. Increased volume often signals that more traders are taking part in the move, which can increase its reliability.
Common Mistakes to Avoid with Engulfing Candles
While the engulfing candle pattern can be a powerful tool, it's important to avoid common pitfalls. Here are some mistakes to watch out for:
Ignoring Market Context: Always consider the broader market context before acting on an engulfing candle. If the overall trend is strongly bullish or bearish, the pattern might not be as reliable.
Acting Too Quickly: Don't jump into a trade just because you spot an engulfing candle. Wait for confirmation from other indicators and check if the reversal aligns with your overall strategy.
Using in Isolation: Avoid relying solely on the engulfing candle pattern. Use it as part of a broader technical analysis strategy to increase its accuracy.
Final Thoughts
The engulfing candle is a valuable pattern that can indicate potential market reversals. While it's not foolproof and can produce false signals, when used correctly in combination with other indicators, it can significantly improve your trading decisions.
Its simplicity and clarity make it a popular choice among traders, but like any other pattern, it should be approached with caution and used in the right context.
Disclaimer: This material is for general information purposes only and is not intended as (and should not be considered to be) financial, investment or other advice on which reliance should be placed. No opinion given in the material constitutes a recommendation by EBC or the author that any particular investment, security, transaction or investment strategy is suitable for any specific person.


