Published on: 2023-07-12
Updated on: 2025-03-12
There are many types of forex trading charts, including K-line charts, line charts, bar charts, and area charts. The K-line chart is the most commonly used method, which displays price fluctuations by drawing rectangles of the opening price, highest price, lowest price, and closing price. A line chart shows the trend of price changes by connecting the points of the closing price. The bar chart represents the range of price changes with columns of different lengths. The area chart displays the price range by filling in the colors. Different chart types have their own advantages, and traders can choose suitable chart types based on their own needs and analysis methods to conduct forex trading analysis and decision-making.

There are several types of forex trading charts:
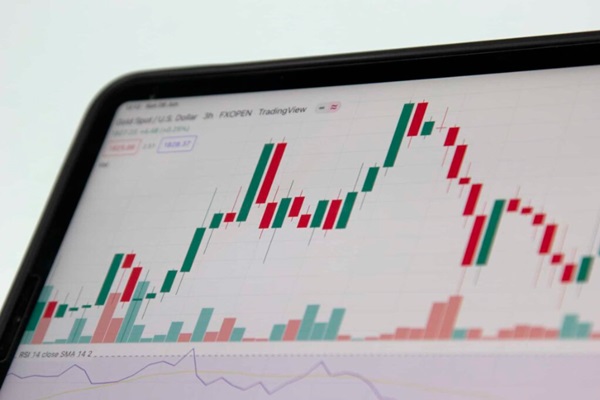
1. Candlestick Chart: The K-line chart is the most common and widely used forex trading chart. It is formed by plotting the opening price, highest price, lowest price, and closing price for each time period, with time as the horizontal axis and price as the vertical axis. The K-line chart can provide rich price information and display changes in price trends and the formation of supporting resistance levels, which is helpful for technical analysis and trading decisions.
2. Line chart: A line chart shows the change in price by connecting the closing price at each time point to form a continuous line. It is concise and clear, able to clearly express price trends and support resistance levels. However, compared with the K line chart, the Line chart may provide less information.
3. Bar Chart: The bar chart displays price changes by plotting the fluctuation intervals of prices during each time period. The length of the column represents the range of prices, and the color of the column represents the fluctuation of prices. A bar chart can visually display the relative changes and trends in prices.
4. Area Chart: An area chart is a chart type based on a line chart. It indicates the price range by filling in the color below the Line chart. The area chart can visually display the fluctuation range of prices and the time period during which prices rise or fall.
These chart types have their own advantages and uses in forex trading. Traders can choose appropriate chart types based on their analysis needs and trading style and combine them with other technical indicators for analysis and trading decisions.
Disclaimer: This material is for general information purposes only and is not intended as (and should not be considered to be) financial, investment or other advice on which reliance should be placed. No opinion given in the material constitutes a recommendation by EBC or the author that any particular investment, security, transaction or investment strategy is suitable for any specific person.