The economic calendar is one of the most important tools in trading. By flagging key data releases, it allows traders to gauge market sentiment and capture immediate price reactions.
Trading Central's economic calendar covers real-time macroeconomic data from 38 countries and regions, helping market participants monitor developments, anticipate shifts, and prepare for potential volatility.
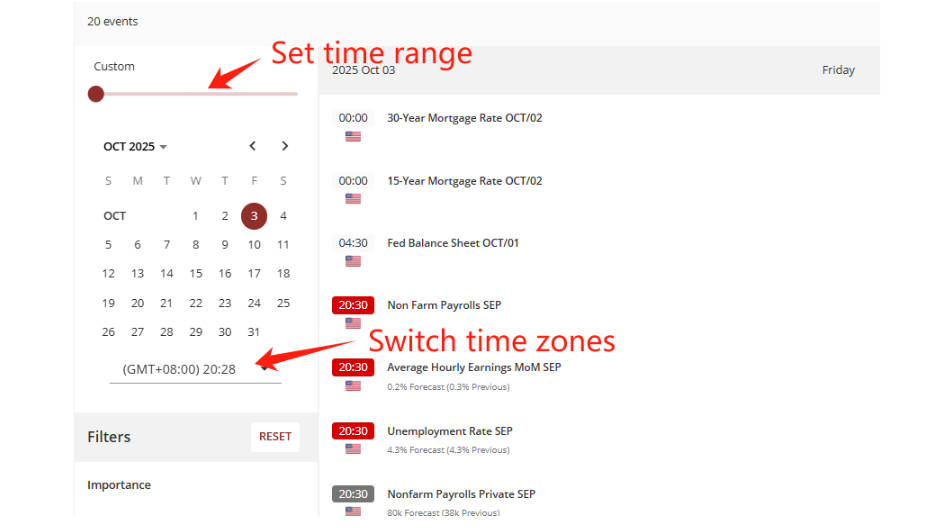
On the left-hand side of the interface, you'll find the control panel, where you can adjust the time range or switch between time zones.
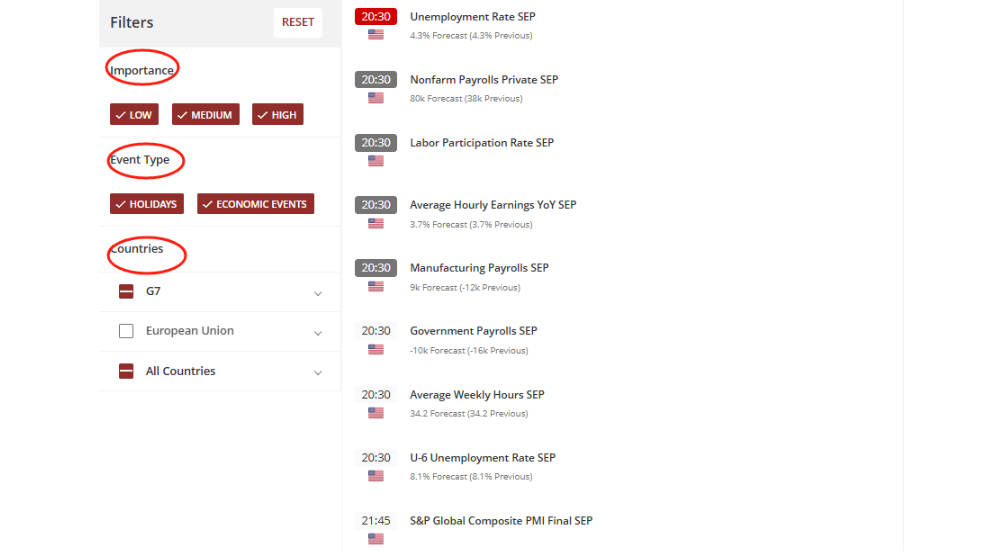
Scrolling further down brings up the filtering options, enabling you to refine events by importance, category, or country for a more targeted view.
The main panel on the right displays the economic data itself.
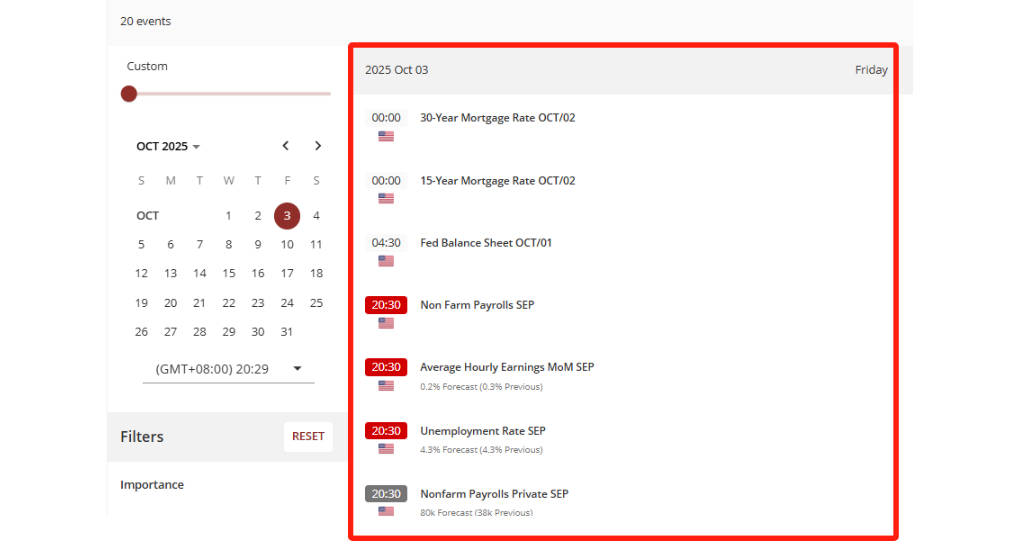
Each entry can be expanded to reveal its level of importance and a corresponding chart.

The Four Sections in the Charts
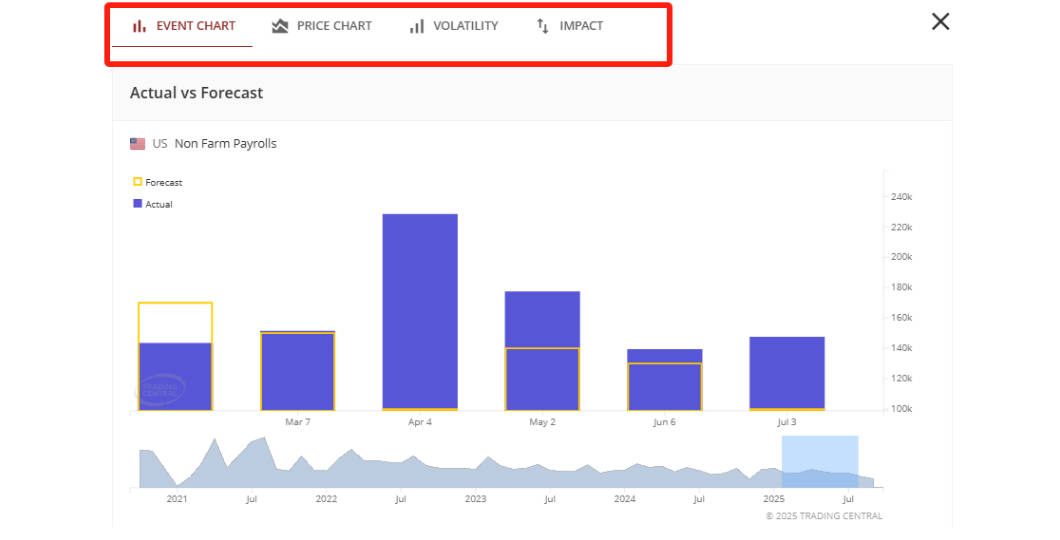
Selecting a chart opens a full-page view with four sections:
1) Event Chart
The Event Chart compares actual figures against forecasts.
2) Price Chart
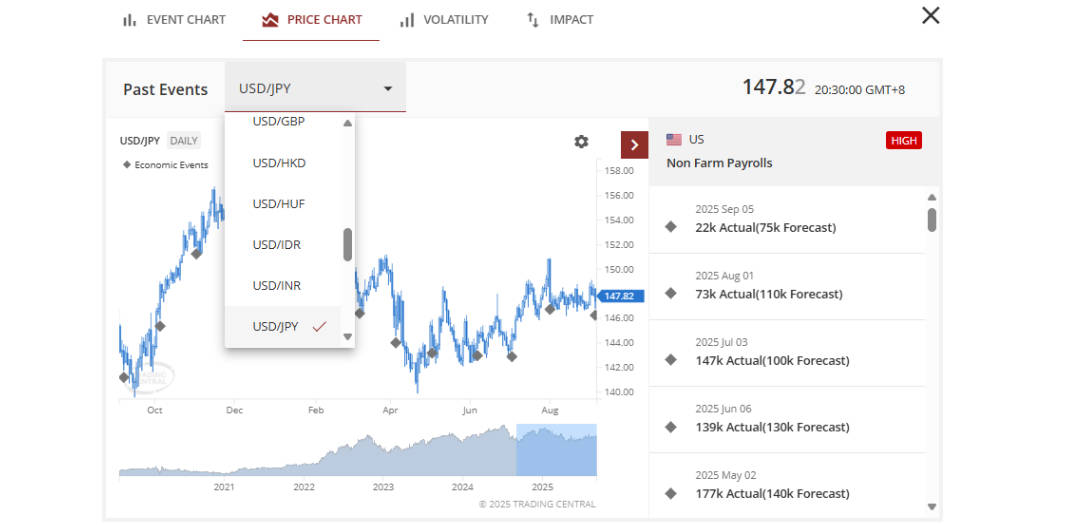
The Price Chart tracks movements in linked symbols.
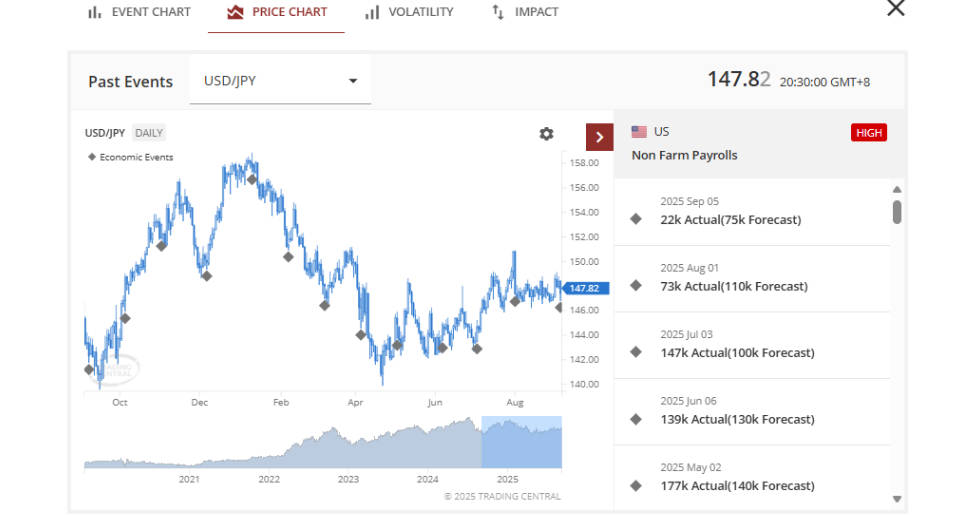
By observing price action at the point of release, you can assess the market impact. Symbols can be switched to see broader effects across assets.
3) Volatility
The Volatility Section shows the average price range following a release.
This helps identify typical bullish or bearish swings, determine whether to fade or follow momentum, and spot potential overbought or oversold conditions.
For example, if the average move is 34.42 points and the market swings beyond this, it may signal stretched positioning.
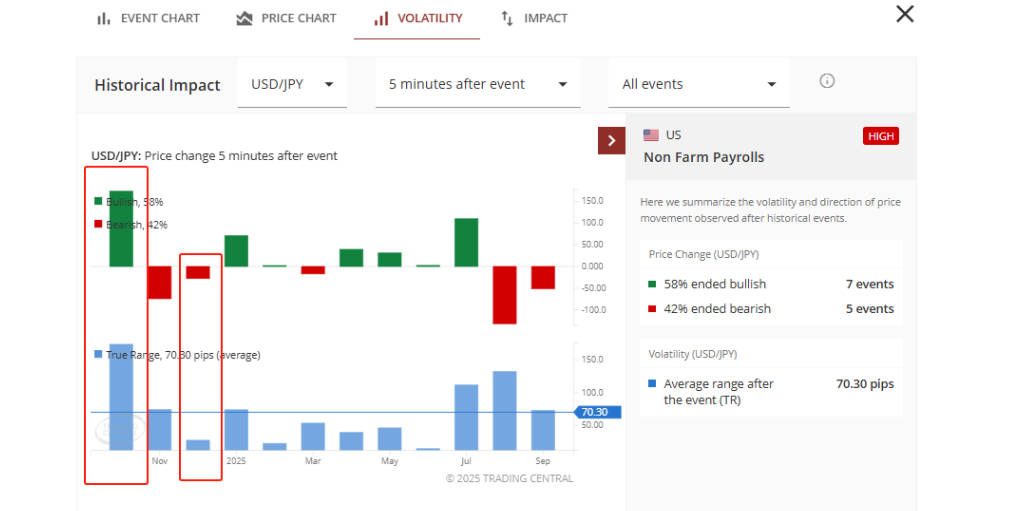
You can also adjust the timeframe (e.g. 4-hour) to assess whether the impact extends beyond the immediate reaction.

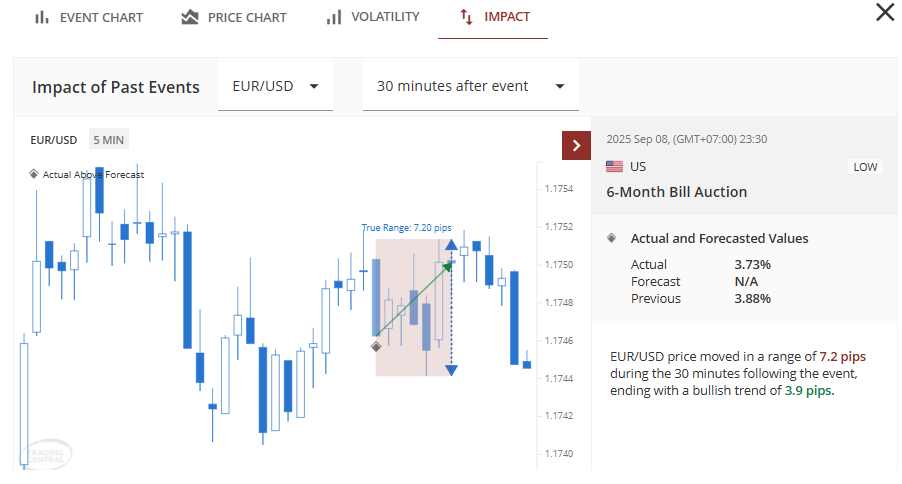
4) The Impact Section
This section highlights the historical performance of related symbols after previous releases.
Unlike the other modules, this focuses on the influence of a single event, marked directly on candlestick charts.
Navigation buttons ("Previous" and "Next") allow you to cycle through past announcements.
Conclusion
Economic events set the tone for markets in the days and weeks ahead. Used effectively, the Trading Central economic calendar offers traders a structured way to anticipate trends, manage risk, and respond with greater confidence.
Disclaimer: This material is for general information purposes only and is not intended as (and should not be considered to be) financial, investment or other advice on which reliance should be placed. No opinion given in the material constitutes a recommendation by EBC or the author that any particular investment, security, transaction or investment strategy is suitable for any specific person.


