The flag pattern is a favourite among forex traders, and for good reason. It's a chart formation that signals continuation, meaning the market is likely to keep moving in the same direction after a brief pause. If you can spot it and understand how to trade it, the flag pattern can help you ride profitable trends without getting caught in market noise. In this article, we'll take a closer look at what the flag pattern is, how to identify it, and how to use it to make smart trading decisions in the forex market. Whether you're new to trading or looking to sharpen your skills, mastering the flag pattern can give you an edge.
What is the Flag Pattern in Forex
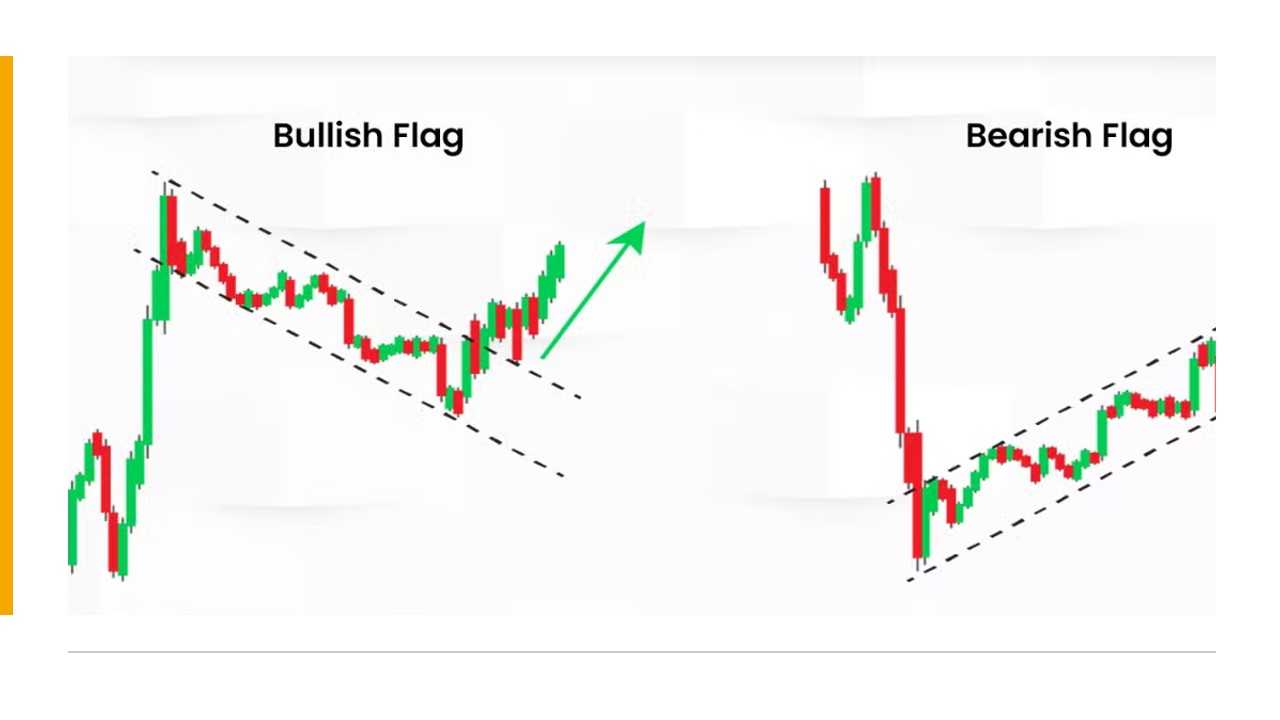
The flag pattern forex traders use is a continuation pattern, representing a temporary pause in the market's momentum before resuming its previous direction. Think of it as a brief consolidation phase before the market takes off again. This formation typically consists of a sharp price movement (the flagpole), followed by a brief consolidation (the flag).
There are two main types of flag pattern forex strategies: bullish and bearish. A bullish flag forms when the market surges upwards, consolidates downward briefly, and then continues climbing. In contrast, a bearish flag occurs when the market drops sharply, consolidates upwards, and then resumes its decline.

These flag patterns are important because they show a temporary pause in the market's momentum, which forex traders interpret as a signal that the trend will continue. Essentially, the market is catching its breath before pushing ahead.
How to Identify the Flag Pattern on Forex Charts
Spotting a flag pattern in forex might sound tricky at first, but once you know the signs, it becomes much easier. Here's what to look for when identifying the flag pattern in a forex chart:
The first thing to notice is the flagpole, which is the sharp and fast price movement that initiates the pattern. This typically happens over a short period, like a few hours or days, and signals a strong trend. Whether the trend is going up or down, the flagpole represents a clear directional move.
Next, the price enters the consolidation phase, forming the flag. This is when the market slows down and starts to move sideways or slightly against the direction of the flagpole. You'll often see a small channel or rectangle that slopes gently in the opposite direction to the flagpole. For a bullish flag pattern in forex, the price will typically move slightly downward during the flag phase, while for a bearish flag, the price will consolidate upward.
Volume is another key indicator. During the flagpole phase, volume tends to surge as the trend picks up speed. However, during the flag phase, volume usually decreases as the market consolidates. When the price breaks out of the flag, ideally, volume should increase again to confirm that the trend is likely to continue.
Common Mistakes to Avoid
One mistake forex traders often make is confusing the flag pattern with other similar chart formations, such as rectangles or pennants. While these patterns share some characteristics, the flag pattern is unique because it features a clear slope against the prevailing trend. A rectangle, for example, has more horizontal price action and isn't usually followed by a strong breakout in the same way a flag pattern is.
Another common pitfall is jumping into a trade too soon. It's tempting to act as soon as you spot a flag pattern, but the real signal comes when the price breaks out of the flag, not before. Entering the trade early can expose you to false breakouts, where the price might reverse rather than continue the trend.
Trading the Flag Pattern in Forex
Now that you know how to spot the flag pattern, the next step is learning how to use it in your trading. The flag pattern is known for providing clear entry points, stop-loss levels, and profit targets, which makes it a great tool for traders who like to have a plan in place.
Entry Points
The best entry point for a flag pattern in forex is when the price breaks out of the flag's consolidation phase. For a bullish flag, this occurs when the price breaks above the upper boundary of the flag. For a bearish flag, you'd wait for the price to break below the lower boundary of the flag.
To confirm the breakout, you'll want to see a strong move with increased volume. If the price moves beyond the flag boundaries without much momentum, it could be a false breakout, so waiting for confirmation helps ensure you're trading in the right direction.
Stop-Loss Placement
A well-placed stop-loss is crucial in managing risk, and with the flag pattern, it's straightforward. For a bullish flag, you'd typically place your stop just below the lower boundary of the flag. For a bearish flag, the stop should go just above the upper boundary.
Another strategy is to use a trailing stop. As the price moves in your favour, a trailing stop will automatically adjust to lock in profits while giving the trade room to breathe. This helps ensure that if the market reverses, you're protected from large losses.
Profit Targets
Setting profit targets with the flag pattern is a little different from other Chart Patterns. The idea is to use the flagpole as a guide. You take the length of the flagpole (the initial sharp move), and project that distance from the breakout point. So, if the flagpole measures 100 pips, you'd expect the price to move at least 100 pips beyond the breakout point after the flag is completed.
This method provides a reasonable estimate of where the price is likely to go, although it's important to remember that forex markets can be unpredictable, and using other indicators can help confirm your target.
Using Other Indicators to Confirm the Flag Pattern in Forex
While the flag pattern is powerful on its own, combining it with other technical indicators can help improve your accuracy. For example, you might use moving averages to confirm the overall trend direction. If the price is above a key moving average (such as the 50-period MA), this confirms a bullish trend and increases the likelihood that the bullish flag will succeed.
Additionally, using oscillators like the Relative Strength Index (RSI) can help you gauge whether the market is overbought or oversold before entering a trade. This helps prevent entering a trade when the market is too extended and might be due for a correction.
In conclusion, the flag pattern is a great tool for forex traders who want to ride trends with confidence. By understanding how to identify it, knowing where to enter and exit, and using risk management strategies like stop-losses and profit targets, you can incorporate the flag pattern into your Trading plan. Don't forget to use other indicators to increase your chances of success, and with time, you'll find that this simple yet effective pattern can become a valuable part of your forex trading toolkit.
Disclaimer: This material is for general information purposes only and is not intended as (and should not be considered to be) financial, investment or other advice on which reliance should be placed. No opinion given in the material constitutes a recommendation by EBC or the author that any particular investment, security, transaction or investment strategy is suitable for any specific person.


