
The commodity market began in 4500 BC when the Sumerians used clay plates to represent goods to be delivered on a predetermined date.
In recent years, the commodity market has undergone tremendous changes, including physical transactions and derivatives used to manage prices.
Some conventional types of commodities include gold, Crude Oil, zinc, lead, silver, natural gas, and cotton. Nowadays, major brokerage companies provide an online commodity trading platform without the need for physical delivery of goods.
According to Fitch Solutions' research, the current global macroeconomic background will continue to be favorable for commodity demand in 2022, with prices maintaining an upward trend relative to the average level from 2017 to 2021.
EBC has compiled a insightful statistical list of global commodity markets. These statistical data also highlight changes in industry trends and investor preferences. The following are important commodity market statistics for investors to understand and research by market or industry researchers.
Commodity Price Forecast for 2022
The World Bank predicts that the average price of crude oil in 2022 will be $74 per barrel, higher than the estimated $70 per barrel in 2021.
The World Bank predicts that after a 22% increase in agricultural product prices in 2021, they will stabilize in 2022.
The World Bank predicts that after an increase of over 80% in energy prices in 2021, energy prices will rise by over 2% in 2022.
The World Bank predicts that the average oil price in 2022 will be $74 per barrel, which is higher than the forecast of $70 per barrel in 2021 and may drop to $65 per barrel by 2023.
The World Bank predicts that after an expected 48% increase in metal prices in 2021, they will decline by 5% in 2022.
Source: World Bank
COVID-19 and the impact of economic recession on commodities
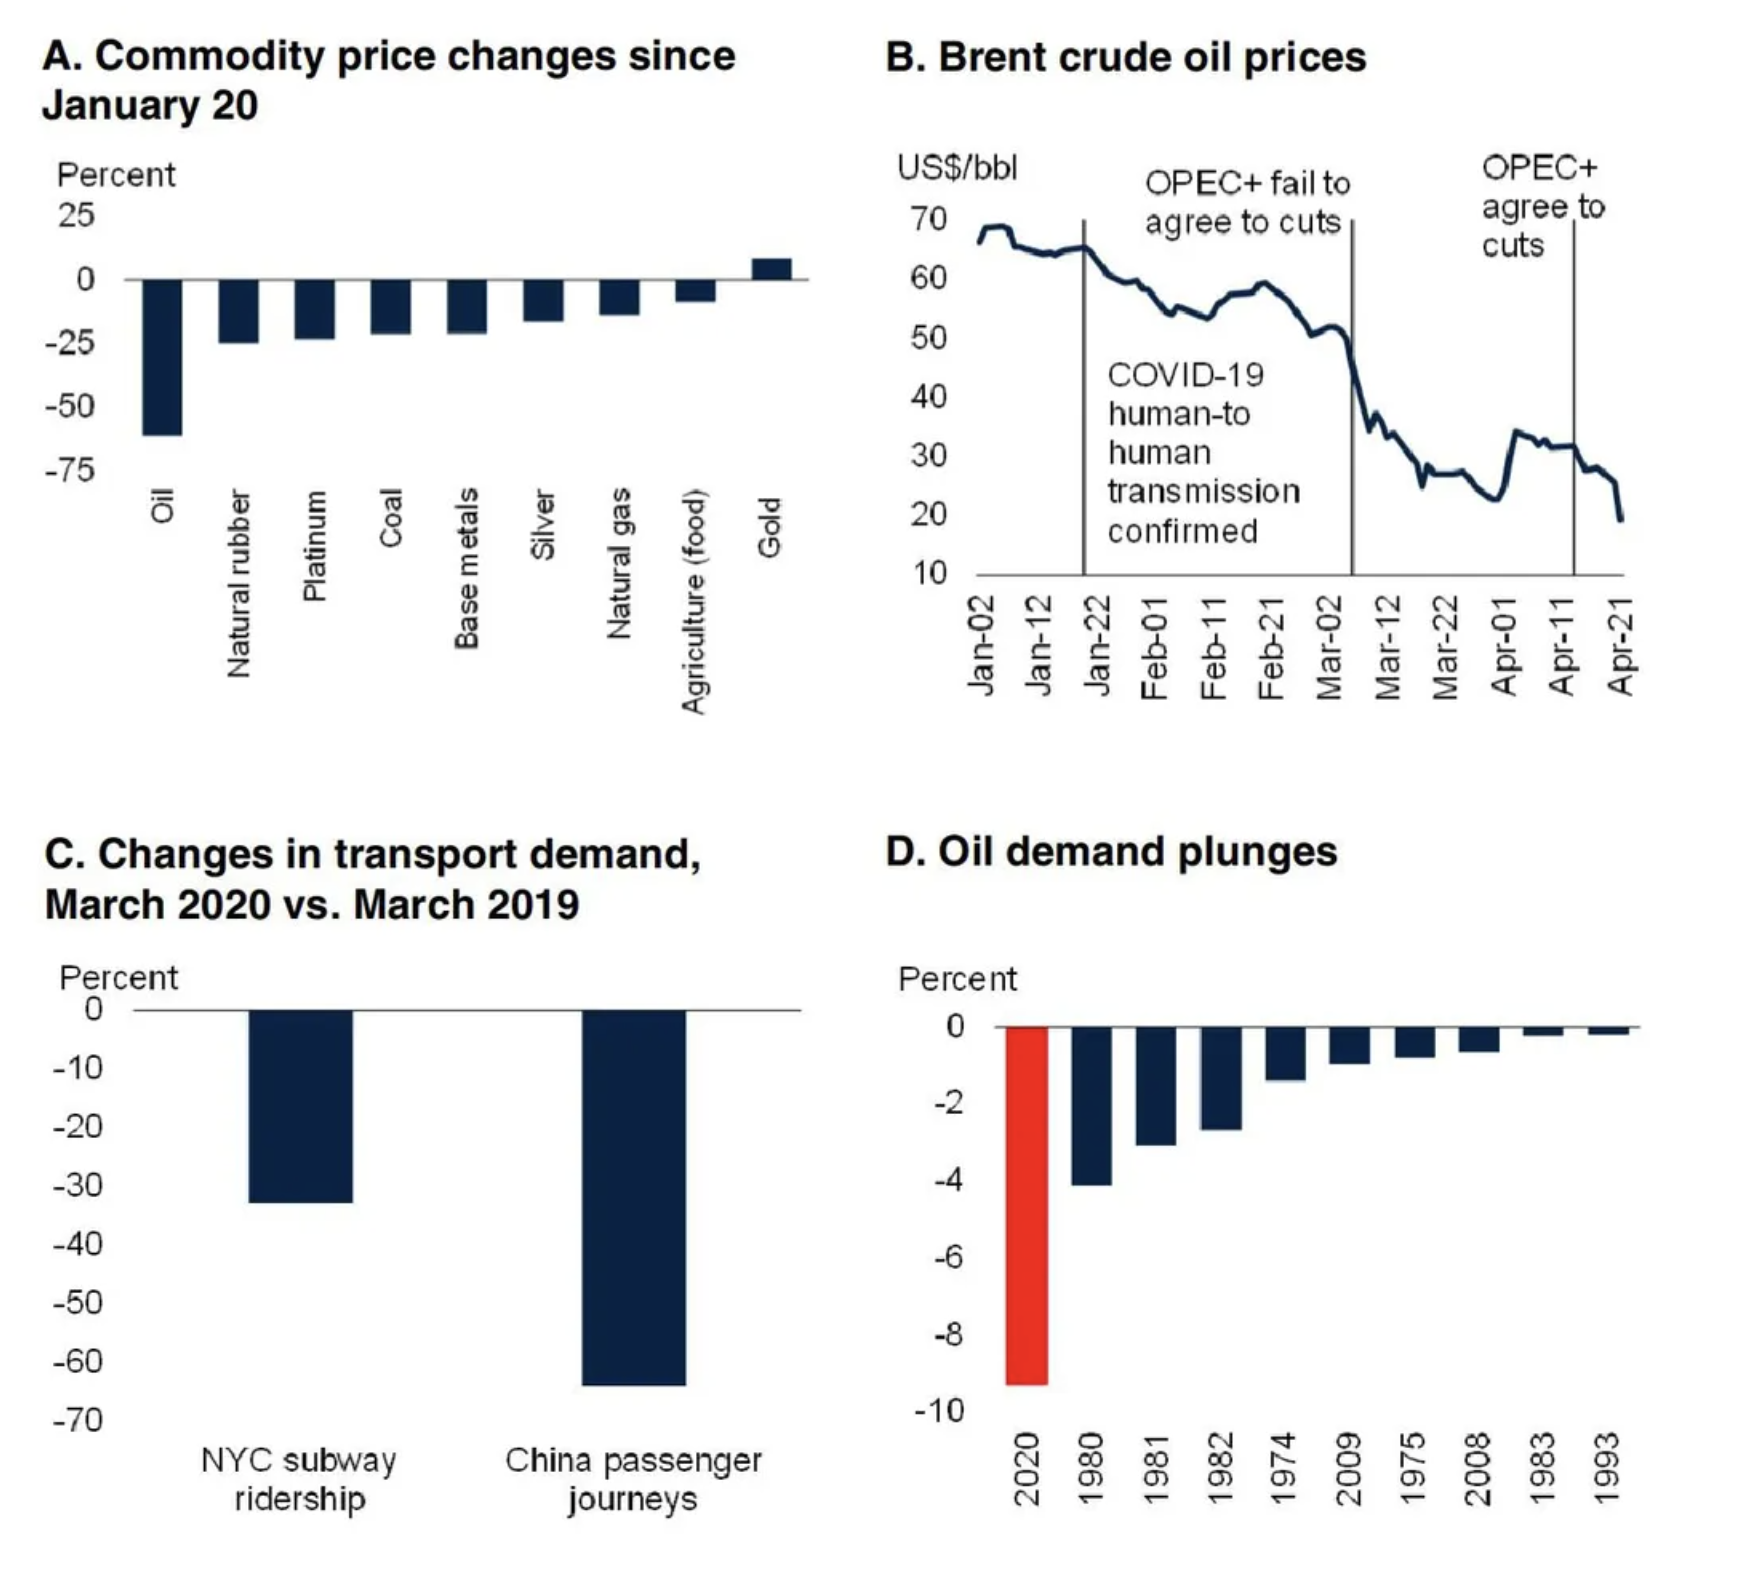
Crude oil demand decreased by 6% (6 mb/d) in the first quarter of 2020, and the International Energy Agency predicts a 23% (23 mb/d) decline by the second quarter of 2020.
From January 2020 to April 2020, the prices of primary food commodities decreased by nearly 9%.
Driven by uncertainty and the flow of Safe Haven Assets, gold prices rose by 8% from January 2020 to April 2020.
From January 2020 to April 2020, copper and zinc prices fell by about 15%, with the largest decline.
The most significant single year decline in oil demand occurred in 1980, when demand decreased by over 4%.
The largest continuous decline in oil consumption occurred from 1980 to 1982, with a 9% decrease in consumption compared to its peak in 1979.
The biggest decline in metal demand occurred during the global economic recession in 1975, when consumption decreased by 17%.
Source: World Bank
Commodity Price Index Prediction and Performance
The FAO Food Price Index, which tracks monthly changes in international prices of commonly used foods, averaged 116 points in February 2021, an increase of 2.4% and 26.5% compared to January and February 2020, respectively.
The FAO Grain Price Index averaged 125.7 points in February 2021, an increase of 26.5% from its level in February 2020.
The FAO Vegetable Oil Price Index averaged 147.4 points in February 2021, an increase of 6.2% from January and the highest point since April 2012.
According to Fitch Solutions Country Risk and Industry Research (FSCRIR) data, its comprehensive commodity price index, including energy, metals, and agriculture, is expected to decline by 7.9% in 2022.
The Standard&Poor's GSCI index is an important commodity index, rising 36.10% to 2690.56 in the first week of December 2021.
Individual product statistics
You will find some of the most interesting statistical data related to many of the most popular products below.
Copper statistics
Due to its high thermal conductivity and conductivity, copper is widely used in construction, engineering, and electronic manufacturing. The ductility of copper also makes it suitable for wiring.
The world's largest copper mining country plays a crucial role in the transition from major industries to low-carbon energy systems.
Chile extracted 5.7 million tons of metal in 2020, making it the world's largest copper producer.
peru is the second largest copper producer, with 2.2 million tons of metal to be mined in 2020.
In 2020, China will mine 1.7 million tons of metal, making it the world's third largest copper producer.
The Democratic Republic of Congo extracted 1.3 million tons of metal in 2020, making it the third largest copper producer.
Source: NS Energy
Cotton statistics
Cotton is one of the main crops in the world that use fiber and food. Cotton fiber can be used to make clothes, sheets, towels, paper, cooking oil, ropes, banknotes, and biofuels.
Cotton does not require much land or water to grow, and since 1980, farmers have been able to produce almost twice as much cotton on the same amount of land.
India is the world's largest cotton producer in 2021, with a production of 6188000 tons.
China is the second largest cotton producing country in the world in 2021, with a yield of 6178318 tons.
The United States is the third largest cotton producing country in the world in 2021, with a production of 3593000 tons.
pakistan is the fourth largest cotton producing country in the world in 2021, with a production of 2374481 tons.
Source: World Population Review
Crude oil statistics
The crude oil production is calculated as the amount of oil extracted from the ground after removing impurities or inert substances. After extraction, the crude oil is distilled to decompose the liquid into various products based on weight. Most crude oil is used for gasoline, jet fuel, diesel, and heating oil, while heavier products such as petroleum jelly are used for travel and lubricants.
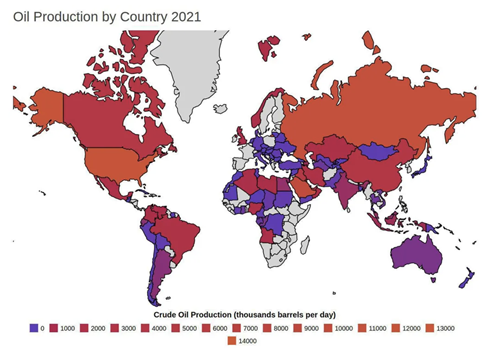
In 2018, the United States surpassed Russia and saudi arabia to become the global leader in crude oil production. Arras, Texas, North Dakota, New Mexico and Oklahoma are the major oil producing countries in the United States.
In 2020, the crude oil production of the United States was 18.61 million barrels per day, accounting for 20% of global crude oil production.
Saudi Arabia's daily production in 2020 was 10.81 million barrels, accounting for 12% of global crude oil production.
In 2020, Russia produced 10.5 million barrels of crude oil per day, accounting for 11% of global crude oil production.
Canada produced 5.23 million barrels of crude oil per day in 2020, accounting for 6% of global crude oil production.
Source: World Population Review, EIA
Gold Statistics
Gold mining is a global business that covers the entire African continent and is mined from various types and sizes of mines.
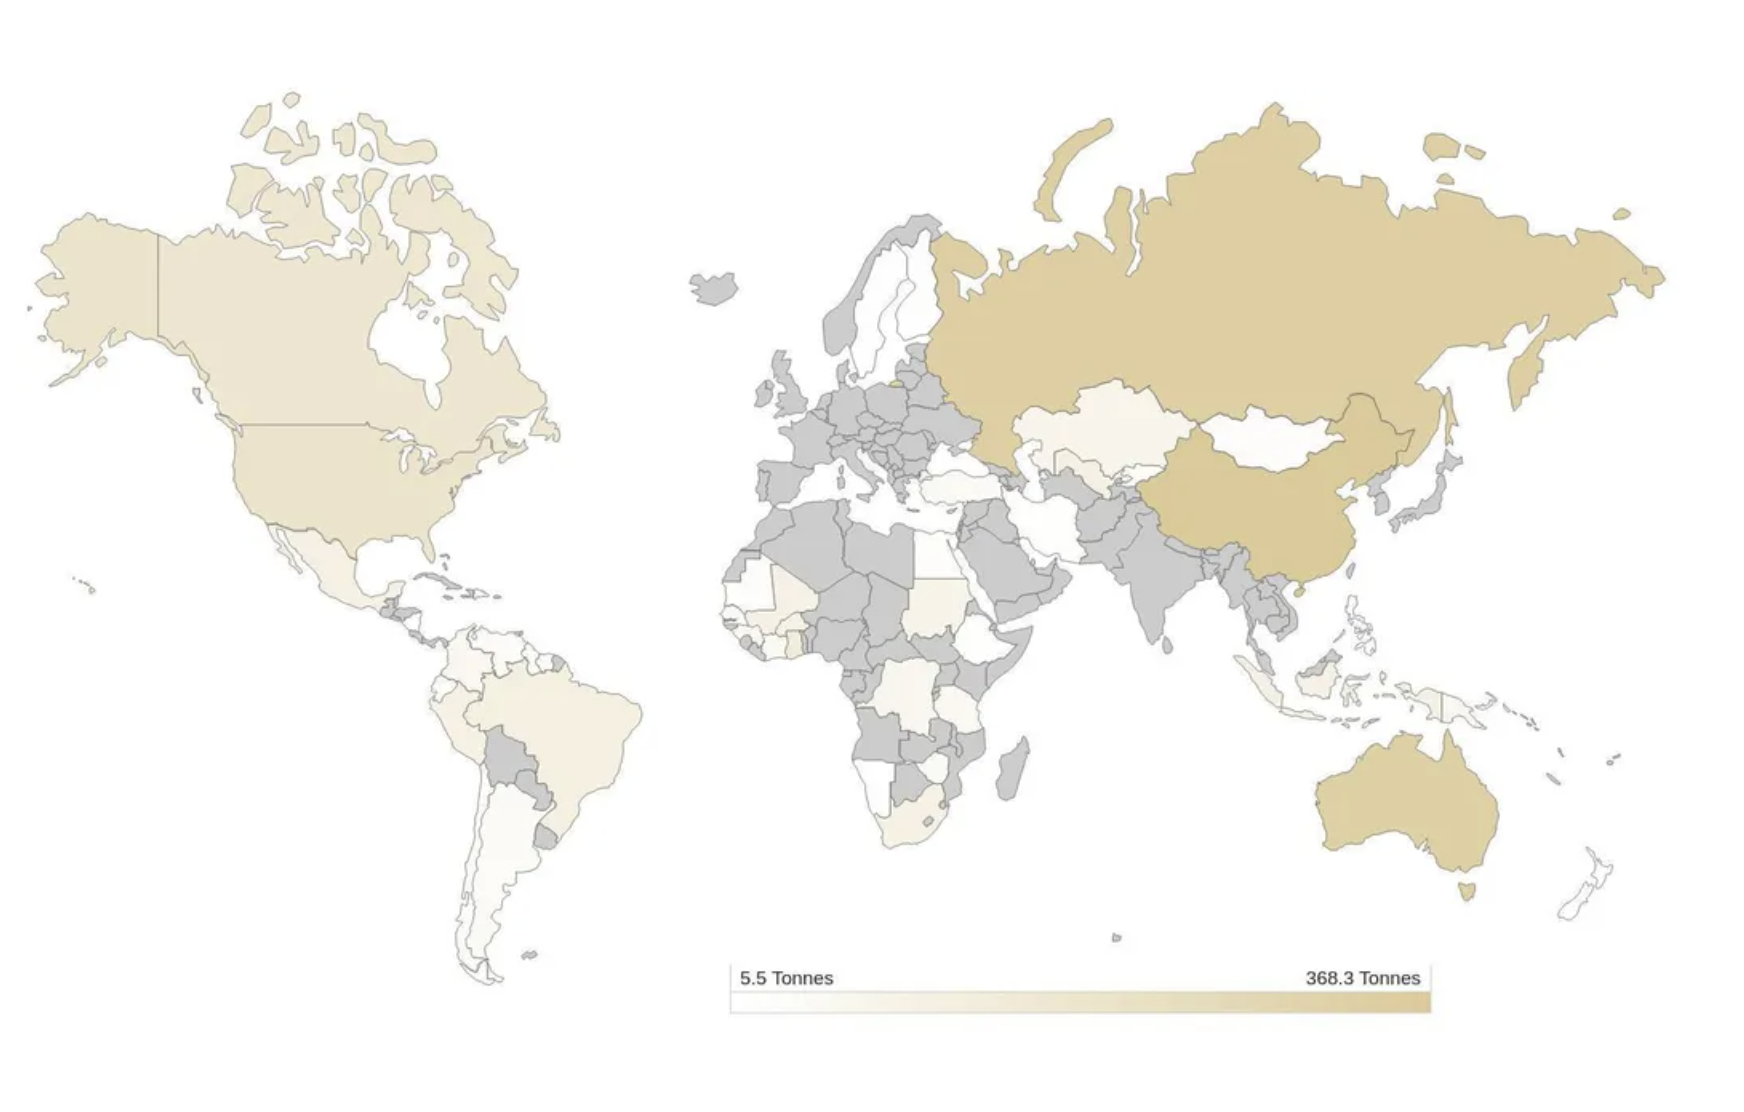
China was the world's largest gold producer in 2020, accounting for approximately 11% of the total global gold mining volume.
China has the world's largest gold mining output, 368.3 tons.
The Russian Federation has the world's second largest gold mining output, 331.1 tons.
Australia has the world's third largest gold mining output, 327.8 tons.
The United States has the fourth largest gold mining output in the world, with 190.2 tons.
Source: Gold.org
Rice Statistics
Rice has been cultivated for centuries. Planting rice is very labor-intensive and requires a lot of water and warm and humid weather conditions. Nearly 120 countries around the world grow rice, with China and India accounting for over 50% of global rice production.
In the United States, rice production has been concentrated in lowland counties in South Carolina and Georgia. However, today, rice in the United States is produced in Arkansas, Mississippi, and Louisiana, with 7.22 metric tons expected to be produced by 2021.
China is the world's largest rice producer, with a production of 148 metric tons in 2021.
India is the second largest rice producing country in the world, with a production of 120 metric tons in 2021.
Bangladesh is the third largest rice producing country in the world, with a production of 35.3 million tons in 2021.
Indonesia is the fourth largest rice producing country in the world, with a production of 34.9 million tons in 2021.
Source: World Agricultural Production
Rubber statistics
Natural rubber exists in the liquid of a plant called Hevea Brasiliensis and is obtained from a white liquid called latex. At the same time, synthetic rubber can be obtained through various monomer polymerization.
This tree is native to the Amazon River basin in South America. We can also find rubber in plantations in Indonesia, the Malay Peninsula, and Sri Lanka.
The global production of natural rubber (NR) is 930000 tons, while the global demand for natural rubber in April 2021 was 1.129 million tons.
thailand was the world's largest rubber producer in 2020, with a production capacity of 4305000 tons.
Indonesia was the second largest rubber producer in 2020, with a production capacity of 3088000 tons.
Malaysia was the third largest rubber producer in the world in 2020, with a production capacity of 997000 tons.
India was the fourth largest rubber producer in the world in 2020, with a production of 891000 tons.
Source: Anrpc.org, Aseanpriefing.com
Soybean statistics
Soybean is one of the most commonly cultivated and used oilseeds, and its uses range from human and animal food to industrial products.
Among all oil crops, soybeans account for 59% of global production, while other crops such as rapeseed, sunflowers, and peanuts account for 12%, 9%, and 8%, respectively.
The United States widely produces soybeans, accounting for 32% of the world's soybean production.
Brazil is the world's largest exporter of soybeans in 2021, with an export volume of 144 million tons.
The United States is the world's second largest exporter of soybeans in 2021, with an export volume of 119.88 million tons.
Argentina is the world's third largest soybean exporter in 2021, with an export volume of 52 million tons.


