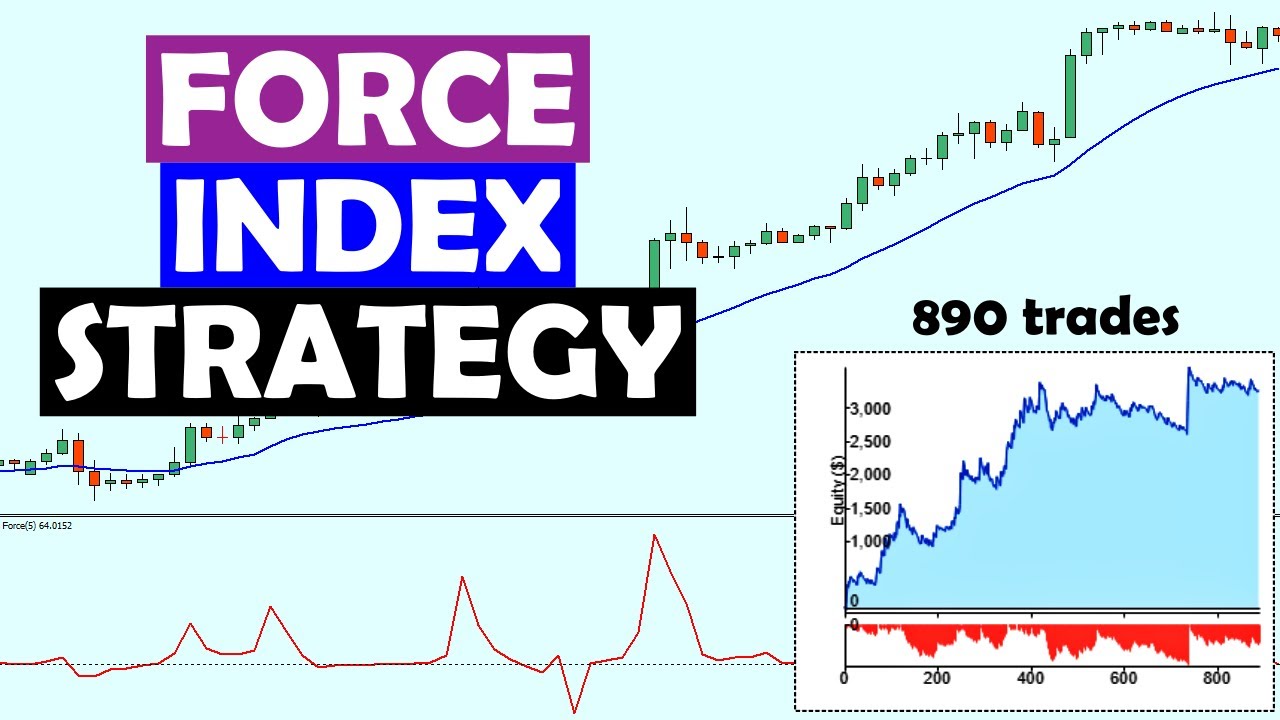
Understanding the true strength behind price movements is essential for traders seeking to make informed decisions in fast-moving markets. The Force Index is a technical indicator that blends price changes with trading volume, providing a clear view of the power driving market trends.
By using the Force Index, traders can confirm trend direction, identify reversals, and improve their timing for entries and exits.
What Is the Force Index?

The Force Index is a momentum oscillator developed by Dr Alexander Elder. It measures the “force” behind a price move by combining three key elements: the direction of price change, the magnitude of that change, and the trading volume associated with it. The result is a single line that fluctuates above and below zero, reflecting the buying and selling pressure in the market.
A positive Force Index value indicates that buyers are in control, pushing prices higher with strong volume. A negative value suggests that sellers dominate, driving prices down with significant volume.
The Force Index can be calculated over various periods, with shorter periods providing more sensitivity and longer periods offering a smoother view of the underlying trend.
How Is the Force Index Calculated?
The Force Index is calculated using the following formula:
Force Index = (Current Close – Previous Close) × Volume
If the current close is higher than the previous close, the value is positive, reflecting buying pressure.
If the current close is lower, the value is negative, indicating selling pressure.
The result is often smoothed with a moving average (such as a 13-period EMA) to reduce noise and highlight meaningful trends.
How to Interpret the Force Index
1. Trend Confirmation
The Force Index is particularly useful for confirming the strength of a prevailing trend. Sustained positive values support a bullish trend, while persistent negative values confirm a bearish trend. When the Force Index aligns with price action, traders gain confidence that the current trend is backed by real market force.
2. Spotting Divergences
Divergence between the Force Index and price can signal a potential reversal. For example:
Bullish Divergence: Price makes a new low, but the Force Index forms a higher low, suggesting selling pressure is weakening and a bullish reversal may follow.
Bearish Divergence: Price makes a new high, but the Force Index forms a lower high, indicating buying pressure is fading and a bearish reversal could be imminent.
3. Entry and Exit Signals
Traders often use zero line crossovers as signals:
Buy Signal: The Force Index crosses above zero, indicating the start of buying pressure.
Sell Signal: The Force Index crosses below zero, signalling the onset of selling pressure.
Additionally, extreme Force Index readings (far above or below zero) may indicate overbought or oversold conditions, prompting traders to look for reversal opportunities.
4. Analysing Volume Spikes
Because the Force Index incorporates volume, it is especially sensitive to periods of high trading activity. Large spikes in the Force Index often correspond to significant market events, such as breakouts or breakdowns, and can alert traders to increased volatility and potential trading opportunities.
Force Index vs. Other Indicators
While the Force Index shares similarities with other momentum and volume-based indicators, it stands out by directly multiplying price change by volume. This approach provides a more nuanced view of market force than indicators that consider only price or volume separately.
The Force Index is often used alongside moving averages, Relative Strength Index (RSI), or MACD for confirmation and to refine trading signals.
Practical Example
Suppose a share closes at 150p yesterday and 155p today, with a trading volume of 20,000. The Force Index for today would be:
Force Index = (155 – 150) × 20,000 = 5 × 20,000 = 100,000
A positive value like this, especially if sustained over several periods, confirms strong buying pressure. If the Force Index then drops below zero as the price stalls, it could signal a weakening trend or a possible reversal.
Strengths and Limitations
Strengths:
Combines price and volume for a comprehensive market view
Confirms trends and highlights potential reversals
Useful across multiple asset classes and timeframes
Limitations:
Can produce false signals in choppy or low-volume markets
Works best when combined with other technical indicators
Sensitive to sudden price spikes or volume surges
Tips for Using the Force Index
Adjust the smoothing period to suit your trading style — shorter for more sensitivity, longer for smoother trends.
Combine the Force Index with trend-following indicators for confirmation.
Watch for divergence as an early warning of trend changes.
Always employ sound risk management, especially when trading on momentum-based signals.
Conclusion
The Force Index is a valuable tool for traders seeking to measure the true strength behind price movements. By integrating price and volume, it helps confirm trends, spot reversals, and refine entry and exit points.
For best results, use the Force Index as part of a broader technical analysis strategy and always practise disciplined risk management.
Disclaimer: This material is for general information purposes only and is not intended as (and should not be considered to be) financial, investment or other advice on which reliance should be placed. No opinion given in the material constitutes a recommendation by EBC or the author that any particular investment, security, transaction or investment strategy is suitable for any specific person.


