The evening star pattern is one of the most reliable bearish reversal signals in technical analysis. Traders use this pattern to identify potential market downturns and time their trades accordingly.
For instance, traders across various financial markets, including forex, stocks, and commodities, used the pattern due to its strong predictive capabilities in signalling buying momentum is weakening while selling pressure is increasing.
Understanding the Evening Star Candlestick Pattern

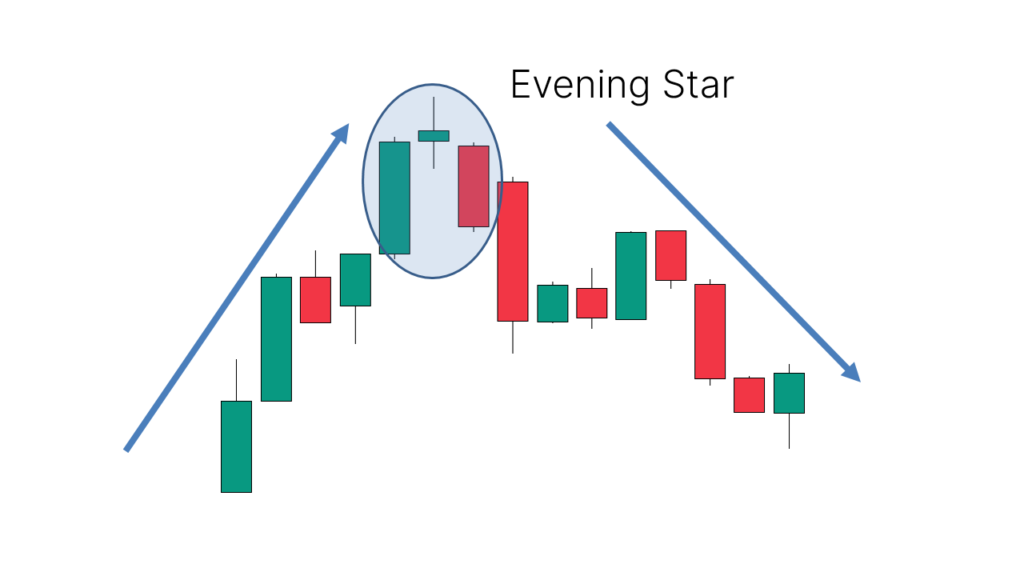
The evening star candlestick pattern is a three-candle formation that signals a potential reversal from an uptrend to a downtrend. Traders rely on it to confirm weakening bullish momentum and the likelihood of bearish control over the market. Recognising the pattern early can help traders enter short positions or exit long trades before a price decline accelerates.
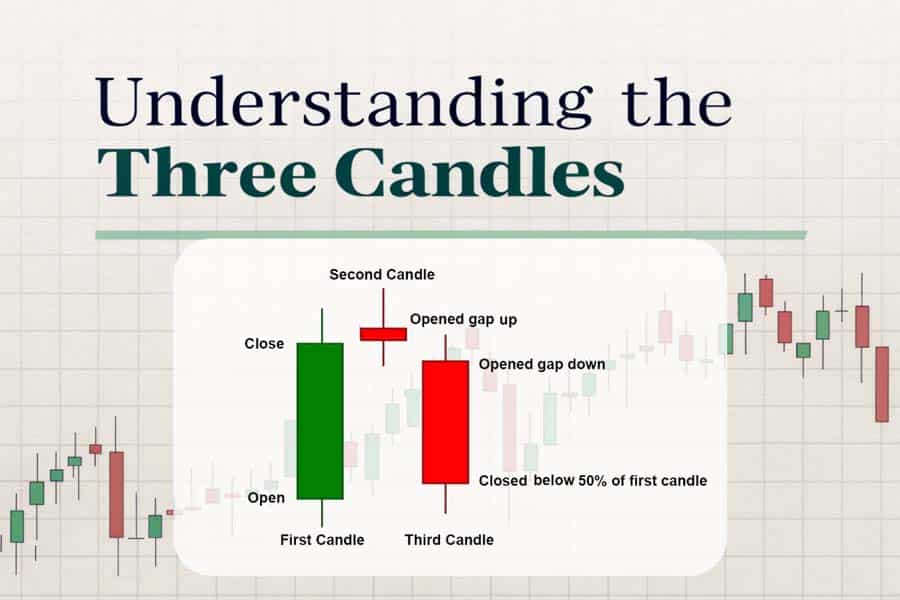
The pattern comprises three distinct candlesticks. The first is a strong bullish candle, which reflects continued buying pressure and an ongoing uptrend. The second candle is a small-bodied candle that can be bullish, bearish, or a doji, indicating market indecision. The third candle is a strong, bearish candle that closes below the midpoint of the first candle, confirming a reversal.
This pattern works best when it forms at key resistance levels or after a prolonged uptrend. The volume accompanying the third candle can provide further confirmation, with higher trading volume strengthening the signal. While no pattern guarantees success, the evening star has historically been a reliable indicator of trend reversals when combined with other technical analysis tools.
How to Spot an Evening Star Candlestick

Recognising the evening star pattern requires careful analysis of price action. The first step is identifying an existing uptrend. The bullish candle that starts the pattern should have a strong body, indicating buyers remain in control.
The second candle is crucial as it reflects a slowdown in bullish momentum and can take different forms. A doji or spinning top in this position enhances the validity of the pattern, as it indicates hesitation among traders. A gap between the first and second candle further strengthens the reversal signal, though it is not always present in forex markets.
The final candle must be a strong, bearish candle that closes below the midpoint of the first candle. This signals that sellers have regained control and that a downward move is likely. Volume analysis can add another layer of confirmation, with increased selling pressure reinforcing the pattern’s strength. Traders should also look at the overall market context, considering support and resistance levels and fundamental factors influencing price movements.
Trading Strategies
Once you identify the pattern, you must decide how to enter a trade, set stop-loss levels, and determine profit targets. The most common approach is to wait for confirmation before opening a position. Entering a trade too early can result in false signals, so waiting for the bearish candle to close or additional indicators to confirm the reversal can improve success rates.
A conservative entry strategy involves placing a sell order just below the low of the third candle. If the price moves below this level, it confirms bearish momentum. Some traders may choose to enter at the opening of the next candle if other technical signals align.
Stop-loss placement is critical in managing risk when trading the pattern. A common approach is to place the stop above the height of the second candle. It ensures that the trade is protected in case the reversal signal fails. Adjusting the stop-loss based on recent resistance levels can also help refine risk management strategies.
Lastly, profit targets should be based on support levels, previous price action, or risk-reward ratios. Many traders aim for a 2:1 or 3:1 reward-to-risk ratio, ensuring potential gains outweigh potential losses. Some traders use trailing stop losses to lock in profits as the price moves in their favour.
Examples of the Evening Star Pattern in Different Markets
As mentioned, you can apply the evening star pattern in various financial markets, including forex, stocks and commodities. While the core principles remain the same, price behaviour and market conditions can affect how the pattern plays out.
In the forex market, gaps between the first and second candle are rare due to continuous trading. However, the Evening Star remains a reliable pattern when found at resistance zones or after strong upward moves. The pattern is particularly effective when combined with other indicators such as moving averages, RSI, or Fibonacci retracement levels.
stock market traders often see the evening star pattern after extended bullish runs, particularly when stocks reach key psychological resistance levels. Volume plays a more significant role in stock trading, and a high-volume decline on the third candle strengthens the pattern’s reliability. Earnings reports and macroeconomic events can also influence the effectiveness of the pattern.
As for the commodities market, the pattern can signal trend reversals in assets like gold, oil, and agricultural products. Given the fundamental factors that drive these markets, traders should consider geopolitical events, supply and demand dynamics, and economic data when using this pattern.
Common Mistakes to Avoid
While the evening star is a powerful reversal pattern, traders should take notice of common mistakes that can impact their success. One of the most frequent mistakes is misidentifying the pattern in a sideways or consolidating market. The evening star pattern is most effective when it appears at the top of a well-established uptrend, as trading in ranging markets can lead to false signals.
Another mistake is ignoring confirmation signals. Entering a trade without waiting for the third bearish candle to close can result in premature entries and increased risk. Traders should always wait for the full pattern to form before executing their trades.
Neglecting volume analysis can also reduce the reliability of the evening star. Higher volume on the bearish candle strengthens the pattern’s validity, whereas low volume may indicate a weak reversal. Combining the pattern with other indicators, such as moving averages or RSI, can improve accuracy and reduce the likelihood of false signals.
Conclusion
In conclusion, the evening star candlestick pattern is a powerful tool for identifying bearish reversals and making informed trading decisions. By understanding its structure, characteristics, and trading strategies, traders can effectively incorporate this pattern into their technical analysis toolkit.
While the evening star pattern can provide high-probability trade setups, risk management remains essential in navigating the uncertainties of financial markets.
Disclaimer: This material is for general information purposes only and is not intended as (and should not be considered to be) financial, investment or other advice on which reliance should be placed. No opinion given in the material constitutes a recommendation by EBC or the author that any particular investment, security, transaction or investment strategy is suitable for any specific person.


