In modern trading, understanding the relationship between price movement and trading volume is crucial for making informed decisions. The Ease of Movement (EOM) indicator, developed by Richard W. Arms, Jr., offers a unique perspective by quantifying how easily an asset's price moves in relation to its trading volume.
This powerful tool helps traders assess the strength of trends, identify potential reversals, and confirm trading signals across a wide range of markets.
What Is the Ease of Movement Indicator?

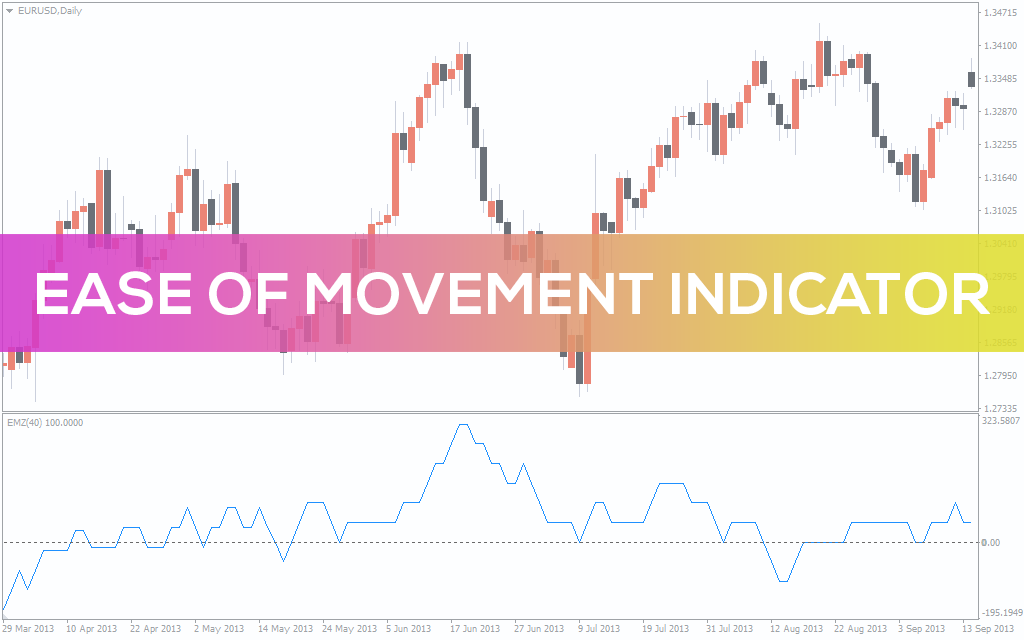
The Ease of Movement (EOM), sometimes called the Ease of Movement Value (EMV), is a volume-based oscillator that measures the “ease” with which price moves up or down. Unlike indicators that focus solely on price or volume, EOM blends both, allowing traders to see whether price changes are happening with significant effort (high volume) or with relative ease (low volume).
When prices rise on low volume, the EOM will show high positive values, suggesting a strong, sustainable uptrend. Conversely, when prices fall on low volume, the EOM will display strong negative values, indicating a bearish trend.
How Is EOM Calculated?
The EOM calculation involves several steps:
1. Calculate the Midpoint:
Find the average of the current period's high and low, and compare it to the previous period's midpoint:
Midpoint Change = (Current High + Current Low) − (Previous High + Previous Low)
--------------------------------------- ---------------------------------------------
2 2
2. Calculate the Box Ratio:
The Box Ratio incorporates both volume and the high-low range:
Box Ratio = Volume
-------------------------------------
Current High - Current Flow
(Often, volume is scaled to keep values manageable.)
3. Calculate EOM Value:
Divide the Midpoint Change by the Box Ratio:
EOM = Midpoint Change
---------------------------
Box Ratio
4. Smoothing:
Most traders use a moving average (often 14 periods) to smooth the EOM line for easier interpretation.The result is an oscillator that fluctuates above and below a central zero line, making it easy to spot shifts in momentum.
How to Interpret the Ease of Movement Indicator
Positive EOM Values:
When EOM values are above zero, it means prices are rising with little resistance, often on low volume. This is typically a bullish signal, suggesting buyers are in control and the uptrend may continue.
Negative EOM Values:
When EOM values are below zero, prices are falling easily, often on low volume. This bearish signal indicates sellers are dominating and the downtrend could persist.
EOM Near Zero:
Values close to zero suggest equilibrium — neither buyers nor sellers have a clear advantage, and the market may be consolidating or lacking strong momentum.
Using EOM in Trading Strategies
1. Trend Confirmation
EOM is a valuable tool for confirming the strength of a prevailing trend. Consistently positive readings support a bullish trend, while persistent negative readings confirm a bearish trend. Traders often look for EOM to align with price action before committing to a trade.
2. Spotting Reversals and Divergences
Divergence between EOM and price can signal a potential reversal. For example, if price makes new highs but EOM fails to reach new highs or starts to decline, it may indicate weakening momentum and a possible trend reversal. Similarly, if price makes new lows but EOM rises, a bullish reversal could be on the horizon.
3. Signal Confirmation
EOM is best used alongside other technical indicators, such as moving averages or volume analysis, to confirm trading signals. For instance, a breakout accompanied by a rising EOM adds confidence to the trade, while a falling EOM during a breakout may suggest caution.
4. Analysing Market Conditions
Sharp moves away from the zero line suggest strong buying or selling pressure, while a flat EOM line near zero indicates a lack of conviction and potential sideways movement. Monitoring these changes helps traders adapt their strategies to current market conditions.
Practical Example
Suppose a share's price rises significantly over several sessions, but volume remains low. The EOM indicator will show strong positive values, indicating that the uptrend is occurring with little resistance.
If, however, the price continues to rise but EOM starts to decline, it may be a warning that the trend is losing strength and a reversal could follow.
Strengths and Limitations
Strengths:
Integrates both price and volume for a comprehensive view.
Highlights trend strength and potential reversals.
Useful across stocks, forex, and commodities.
Limitations:
Can produce false signals in choppy or illiquid markets.
Should not be used as a stand-alone indicator—confirmation is key.
Sensitive to sudden volume spikes or price gaps.
Tips for Using EOM Effectively
Adjust the smoothing period to match your trading style and asset volatility.
Combine EOM with other indicators for stronger signals.
Watch for divergences as early warning signs of trend changes.
Always use sound risk management, especially when trading on momentum-based signals.
Conclusion
The Ease of Movement indicator offers traders a unique way to analyse the interplay between price and volume. By revealing how easily prices move, EOM helps confirm trends, spot reversals, and improve trading decisions.
For best results, use EOM as part of a broader technical analysis toolkit and always combine it with disciplined risk management.
Disclaimer: This material is for general information purposes only and is not intended as (and should not be considered to be) financial, investment or other advice on which reliance should be placed. No opinion given in the material constitutes a recommendation by EBC or the author that any particular investment, security, transaction or investment strategy is suitable for any specific person.


