Donchian Channels are a powerful and straightforward technical analysis tool, widely used by traders to identify breakouts, trends, and shifts in market volatility.
Developed by Richard Donchian, a pioneer in managed futures, this indicator has become a staple for those seeking to capitalise on significant price movements across forex, commodities, and stock markets. By providing clear visual cues, Donchian Channels help traders make informed decisions on entry, exit, and risk management.
What Are Donchian Channels?

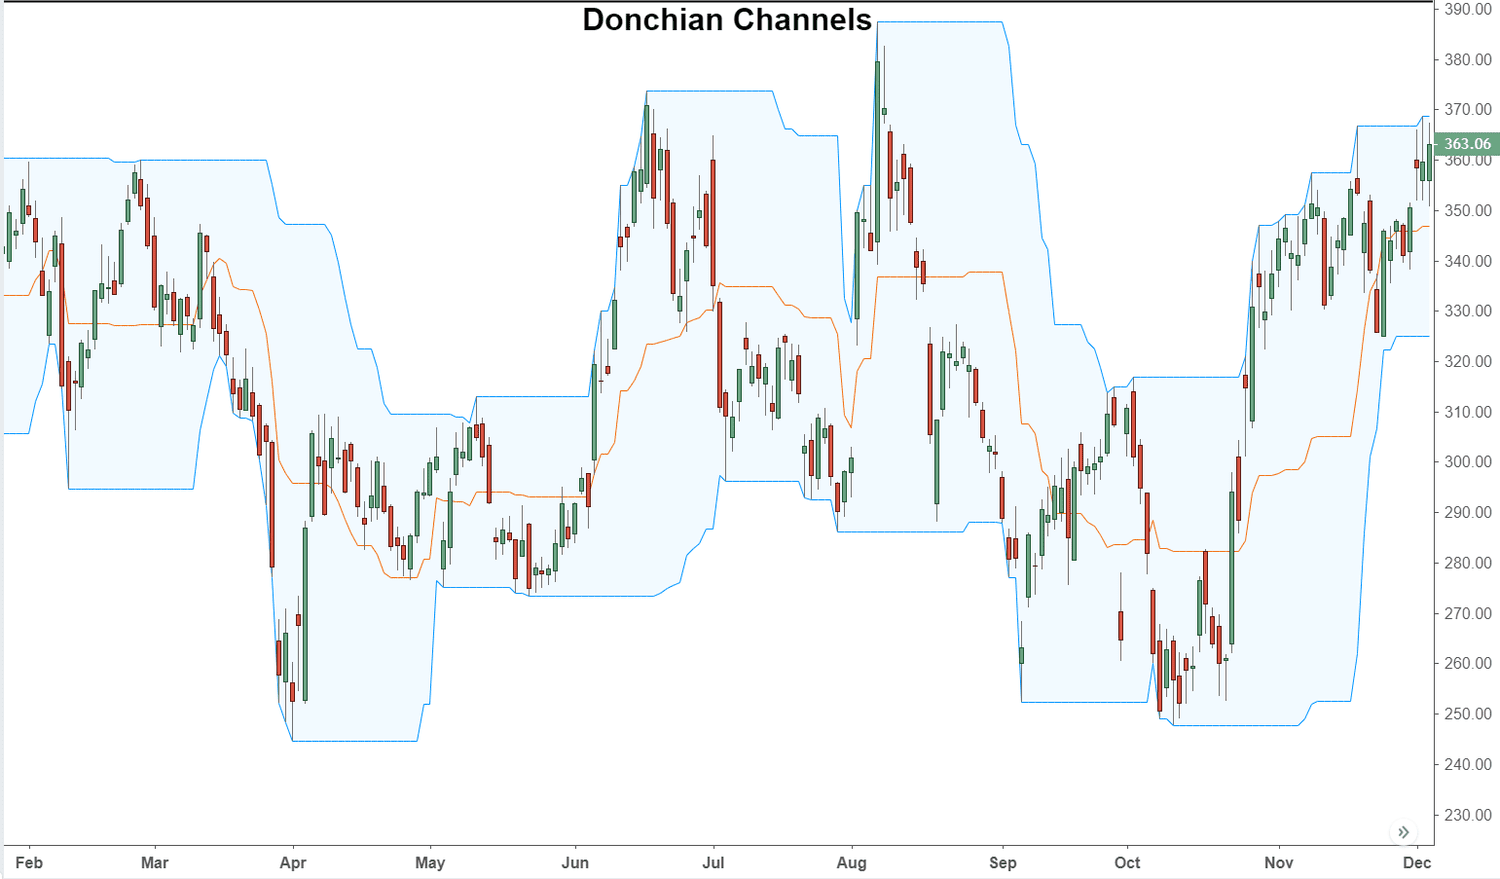
Donchian Channels are a type of channel trading indicator that plots three lines on a price chart: an upper band, a lower band, and a middle band. The upper band marks the highest price of an asset over a chosen number of periods, while the lower band marks the lowest price over the same period. The middle band is simply the average of the upper and lower bands.
The most common setting is 20 periods, representing roughly a month of trading days, but traders can adjust this to suit their strategies or market conditions.
Formula:
Upper Band: Highest high over the last N periods
Lower Band: Lowest low over the last N periods
Middle Band: (Upper Band + Lower Band) / 2
This simplicity makes Donchian Channels highly accessible and easy to interpret, even for those new to technical analysis.
How Do Donchian Channels Work?
The main function of Donchian Channels is to measure price volatility and highlight potential breakout points. When the price of an asset consistently trades near the upper band, it signals a strong uptrend and bullish sentiment.
Conversely, trading near the lower band suggests a downtrend and bearish sentiment. The area between the bands represents the asset's trading range, and the width of the channel reflects market volatility — wider channels indicate higher volatility, while narrower channels suggest consolidation.
Key Uses of Donchian Channels in Trading
1. Identifying Breakouts
One of the most popular uses of Donchian Channels is spotting breakouts. When the price closes above the upper band, it signals a potential bullish breakout and a possible buying opportunity. If the price falls below the lower band, it may indicate a bearish breakout, suggesting a potential sell or short position. These signals are especially valuable in markets where trends can develop rapidly after periods of consolidation.
2. Following Trends
Donchian Channels are also effective for trend-following strategies. If the price remains near or above the upper band, it confirms the presence of an uptrend. If the price hugs the lower band, it signals a downtrend. Traders can use these cues to ride trends and avoid trading against the prevailing market direction.
3. Support and Resistance
The upper and lower bands of the Donchian Channel act as dynamic support and resistance levels. A bounce off the lower band might be interpreted as a buying opportunity, while resistance at the upper band can be a cue to take profits or consider selling.
4. Volatility Analysis
The width of the Donchian Channel is a direct measure of market volatility. When the channel widens, it indicates increased volatility and larger price swings. A narrowing channel suggests reduced volatility and possible consolidation, which often precedes a breakout.
5. Setting Stop-Loss and Exit Points
Many traders use Donchian Channels to set stop-loss orders and determine exit points. For example, a common strategy is to set a stop-loss just below the lower band when buying, or just above the upper band when selling short. This helps limit potential losses if the market moves unfavourably.
Combining Donchian Channels with Other Indicators
While Donchian Channels are effective on their own, combining them with other technical indicators can improve reliability. Moving averages, volume analysis, or the MACD can confirm the strength of a breakout or trend.
For example, a breakout above the upper band accompanied by high trading volume is more likely to signal a genuine trend change.
Practical Example
Suppose a trader is analysing a currency pair using a 20-day Donchian Channel. If the price breaks above the upper band after a period of sideways movement, this may indicate the start of a new uptrend. The trader might enter a long position, set a stop-loss just below the lower band, and use the middle band as a potential target or trailing stop.
Advantages and Limitations
Advantages:
Simple to calculate and interpret
Effective for identifying breakouts and trends
Adaptable to any timeframe or market
Limitations:
Can produce false signals in choppy, sideways markets
Best used with confirmation from other indicators
Not predictive—reacts to price rather than forecasting moves
Tips for Using Donchian Channels
Adjust the period length to match your trading style and asset volatility.
Always confirm breakout signals with volume or momentum indicators.
Use Donchian Channels as part of a broader trading plan that includes risk management and position sizing.
Conclusion
Donchian Channels offer a clear, visual method for identifying trends, breakouts, and market volatility. Their simplicity and adaptability make them suitable for traders of all levels.
By understanding how to interpret Donchian Channels and combining them with other analysis tools, you can enhance your trading strategy and make more confident decisions in dynamic markets.
Disclaimer: This material is for general information purposes only and is not intended as (and should not be considered to be) financial, investment or other advice on which reliance should be placed. No opinion given in the material constitutes a recommendation by EBC or the author that any particular investment, security, transaction or investment strategy is suitable for any specific person.


