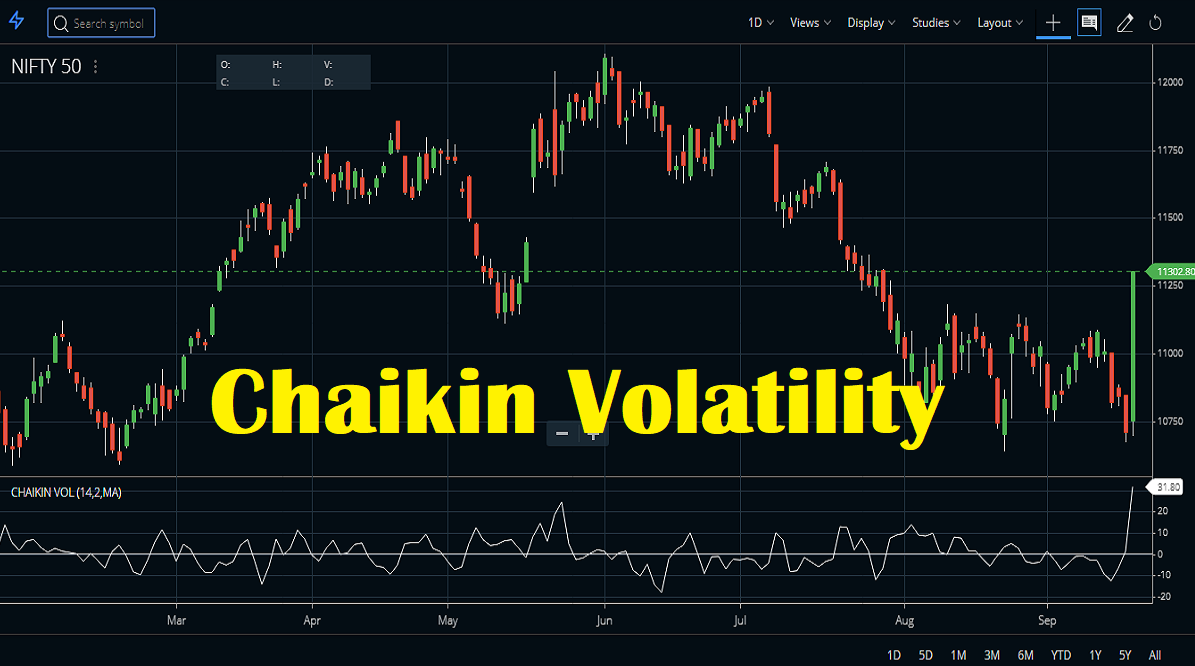
In the world of financial markets, volatility plays a crucial role in shaping investment strategies. For many investors, managing volatility can be one of the most challenging aspects of trading. This is where Chaikin Volatility comes into play — offering a reliable and effective way to assess market fluctuations.
At EBC Financial Group, we believe that understanding volatility is essential for making informed investment decisions. In this article, we’ll explain what Chaikin Volatility is, how it works, and how you can use it to enhance your trading strategy.
What Is Chaikin Volatility?

Chaikin Volatility is an indicator that measures the extent of price fluctuations in the market, taking both price movement and trading volume into account. Unlike traditional volatility indicators, Chaikin Volatility is more comprehensive because it includes the volume behind price changes, offering a clearer picture of market activity.
Developed by Marc Chaikin, this tool helps investors and traders gauge whether the market is in a period of high volatility, which can present opportunities, or low volatility, which may signal a period of consolidation.
Why Chaikin Volatility Is Essential for Traders
For traders, recognising periods of volatility is crucial. High volatility often indicates that the market is in a state of flux, which can lead to price breakouts or breakdowns. On the other hand, low volatility suggests stability, but it can also mean fewer opportunities for significant gains.
Chaikin Volatility helps traders assess these fluctuations, providing insights into when the market might be on the verge of a major movement. By incorporating Chaikin Volatility into your trading strategy, you can be more prepared for market shifts.
How to Use Chaikin Volatility in Trading
The Chaikin Volatility indicator can be used in a variety of ways to improve trading decisions. Here are some of the most effective ways to use this tool:
1) Identifying Breakouts: Chaikin Volatility is particularly useful for spotting breakouts. When volatility increases, it often signals that the market is preparing for a sharp price movement. Traders can use this information to enter positions early, capitalising on potential price swings. Many trading platform provides easy access to real-time volatility data, helping traders make timely decisions.
2) Confirming Trends: As well as identifying potential breakouts, Chaikin Volatility can be used to confirm trends. A rise in volatility often indicates that a current trend is gaining strength. Conversely, a decrease in volatility can suggest that the market is consolidating, or that a trend might be weakening.
3) Risk Assessment: High volatility typically signals increased risk. Traders can use Chaikin Volatility to assess risk and adjust their stop-loss levels accordingly. By understanding when the market is likely to experience large movements, traders can make more informed decisions about position sizes and risk management.
Chaikin Volatility vs. Traditional Volatility Indicators
While traditional volatility indicators such as Average True Range (ATR) or Bollinger Bands focus on price movement alone, Chaikin Volatility takes volume into account, offering a more comprehensive view.
This inclusion of volume data allows for a more nuanced understanding of market conditions, helping traders gauge not just price, but the strength of the price movement. By using multiple indicators in conjunction, investors can create a more well-rounded trading strategy.
How to Interpret Chaikin Volatility
To interpret Chaikin Volatility, there are a few key patterns to watch for:
Falling Volatility: A decrease in volatility indicates a quieter, more stable market. This might suggest that trends are consolidating, and there could be fewer trading opportunities in the short term.
Practical Example of Using Chaikin Volatility
Consider a trader using the Chaikin Volatility indicator on a stock that has been moving within a narrow range. If the Chaikin Volatility begins to rise, it suggests that the stock is experiencing increasing fluctuations and may be about to break out of its range. This is a signal to the trader that the stock might be primed for a larger move, providing an opportunity to enter a trade.
By using the data available on platforms, traders can optimise their entry points and better predict market movements.
Combining Chaikin Volatility with Other Indicators
To enhance your analysis, Chaikin Volatility can be used alongside other technical indicators. Combining it with tools like Relative Strength Index (RSI) or Moving Averages can give traders a clearer view of market conditions.
Conclusion
Chaikin Volatility is an essential tool for any serious investor or trader looking to understand and capitalise on market fluctuations. By tracking volatility and using it in conjunction with other technical indicators, traders can optimise their strategies and improve their chances of success.
Whether you’re looking for breakout opportunities, confirming trends, or assessing risk, Chaikin Volatility can help you navigate the complexities of the market with greater confidence.
Disclaimer: This material is for general information purposes only and is not intended as (and should not be considered to be) financial, investment or other advice on which reliance should be placed. No opinion given in the material constitutes a recommendation by EBC or the author that any particular investment, security, transaction or investment strategy is suitable for any specific person.


