In today's dynamic financial markets, understanding the balance between buying and selling pressure is essential for successful trading. The Chaikin Money Flow (CMF) indicator offers traders a powerful way to assess this balance by combining price action with trading volume.
By interpreting CMF signals, traders can confirm trends, identify potential reversals, and make more informed entry and exit decisions.
What Is the Chaikin Money Flow Indicator?

The Chaikin Money Flow is a volume-weighted oscillator developed by Marc Chaikin. It measures the accumulation (buying) and distribution (selling) of an asset over a specified period, typically 20 or 21 days.
The indicator fluctuates between positive and negative values, with a central zero line dividing bullish and bearish territory. CMF values rarely reach the extremes of +1 or -1, but readings above +0.25 or below -0.25 are often seen as strong signals of trend strength.
The core principle behind CMF is that if an asset consistently closes near its high on increasing volume, there is accumulation and buying pressure. Conversely, regular closes near the low on high volume indicate distribution and selling pressure.
How Is Chaikin Money Flow Calculated?
The CMF calculation involves several steps:
1. Money Flow Multiplier:
[(Close - Low) - (High - Close)] /(High - Low) = Money Flow Multiplier
This value ranges from -1 to +1, depending on where the close falls within the period's range.
2. Money Flow Volume:
Multiply the Money Flow Multiplier by the period's volume.
3. CMF Value:
Sum the Money Flow Volume over the chosen period (e.g., 21 days) and divide by the total volume for the same period.
The result is a value oscillating between -1 and +1, but most readings fall between -0.50 and +0.50.
How to Use the Chaikin Money Flow Indicator
1. Trend Confirmation
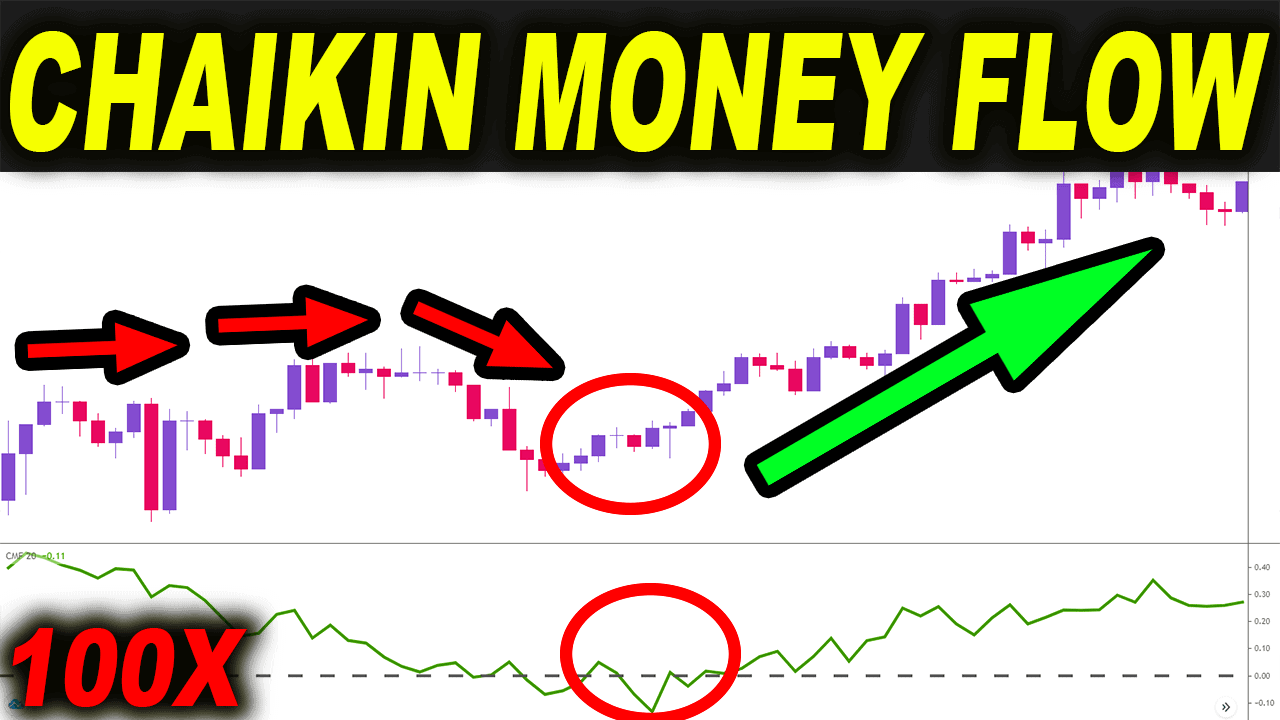
When the CMF is above zero, it signals buying pressure and supports a bullish trend. If it remains below zero, selling pressure dominates, confirming a bearish trend. Persistent readings above or below the zero line suggest the trend is likely to continue.
2. Entry and Exit Signals
Entry: A cross above the zero line can be used as a buy signal, while a cross below zero may indicate a sell opportunity.
Exit: If holding a long position and the CMF drops below zero, it may be time to exit. Conversely, if short and the CMF rises above zero, consider closing the position.
3. Divergence
Divergence between the CMF and price action can signal potential reversals:
Bullish Divergence: Price makes lower lows while CMF forms higher lows—this may indicate weakening selling pressure and a possible upward reversal.
bearish divergence: Price makes higher highs while CMF forms lower highs—this could signal fading buying pressure and a potential downward reversal.
4. Volume Confirmation
CMF incorporates volume, making it valuable for confirming the validity of price breakouts. For example, if price breaks resistance and the CMF is positive, the breakout is more likely to be genuine.
5. Overbought and Oversold Conditions
Extreme CMF readings (near +1 or -1) are rare but can indicate overbought or oversold markets. These conditions may precede a reversal, especially if confirmed by other indicators or price action.
Practical Example
Suppose a currency pair is trading in an uptrend and the CMF remains above zero, confirming sustained buying pressure. If the price pulls back but the CMF stays positive, this could be a buying opportunity. Conversely, if the CMF drops below zero during the uptrend, it may warn of a weakening trend or imminent reversal.
Strengths and Limitations of CMF
Strengths:
Combines price and volume for a more complete market view.
Confirms trends and signals potential reversals.
Useful for both short-term and long-term trading strategies.
Helps filter out false breakouts when used with other indicators.
Limitations:
Can give false signals in choppy or low-volume markets.
Not a standalone tool—best used with other technical analysis methods.
Lags during sudden market reversals due to its averaging period.
Tips for Using Chaikin Money Flow
Adjust the lookback period (e.g., 10, 20, or 21 days) to suit your trading timeframe and asset volatility.
Combine with trendlines, support/resistance, or momentum indicators for confirmation.
Watch for divergence as an early warning of trend changes.
Use CMF as a filter for trade setups, ensuring volume supports the price move.
Conclusion
The Chaikin Money Flow indicator is a versatile and insightful tool for traders seeking to understand the forces driving price movements. By measuring the interplay of price and volume, CMF helps confirm trends, spot reversals, and improve trading accuracy.
For best results, incorporate CMF into a broader trading strategy and always use sound risk management.
Disclaimer: This material is for general information purposes only and is not intended as (and should not be considered to be) financial, investment or other advice on which reliance should be placed. No opinion given in the material constitutes a recommendation by EBC or the author that any particular investment, security, transaction or investment strategy is suitable for any specific person.


