In technical analysis, the ascending triangle pattern is one of the most widely recognised and reliable chart formations. Unlike its counterpart, the descending triangle pattern, it is a continuation pattern that signals potential bullish breakouts in an asset's price movement.
Traders and investors use this pattern to identify high-probability trading opportunities when price action creates a series of higher lows while facing resistance at a horizontal level. This pattern provides clear entry and exit points and suggests that buyers are gaining control, increasing the likelihood of a breakout to the upside.
Understanding the Ascending Triangle Pattern

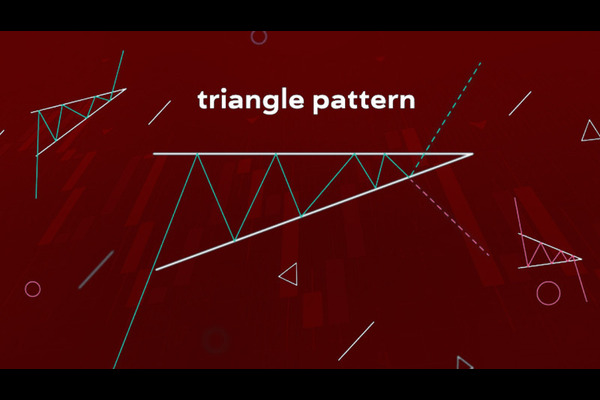
The ascending triangle pattern consists of two key components: a rising trendline that connects a series of higher lows and a horizontal resistance level that acts as a price barrier. This pattern typically forms during an uptrend and indicates that buyers are pushing prices higher while sellers attempt to defend a specific resistance level.
However, an ascending triangle pattern is only considered valid when it meets specific criteria. First, there must be a clear uptrend leading into the formation of the pattern. The rising trendline should connect at least two or more higher lows, showing a steady increase in buying pressure. The horizontal resistance level should be tested multiple times, indicating that sellers defend that price point. The duration of the pattern can vary, with shorter formations occurring over weeks and longer patterns forming over months. The breakout from the triangle should be accompanied by a spike in volume, confirming strong market participation.
As the price consolidates within the triangle, buying pressure increases, and when demand eventually overcomes supply, a breakout occurs. The longer the pattern develops, the stronger the breakout tends to be, as traders and investors accumulate positions ahead of a price surge.
In short, the formation of an ascending triangle pattern reflects market psychology. For example, the higher lows indicate buyers are stepping in at increasingly higher price levels, demonstrating confidence in the uptrend. The horizontal resistance level represents a price point where sellers defend against further upward movement. As the pattern progresses, the repeated resistance testing weakens selling pressure, increasing breakout chances. When the price finally breaches the resistance level, it often triggers a surge in buying activity, leading to significant price appreciation.
How to Identify an Ascending Triangle on a Chart

Spotting an ascending triangle on a price chart requires observing the price action and trendline structures. Traders first look for an existing uptrend, as the ascending triangle is most effective as a continuation pattern. The rising trendline should be drawn by connecting a series of higher lows, confirming buyers are stepping in at progressively higher levels. The horizontal resistance line is identified by pinpointing a price level that has repeatedly prevented further upward movement.
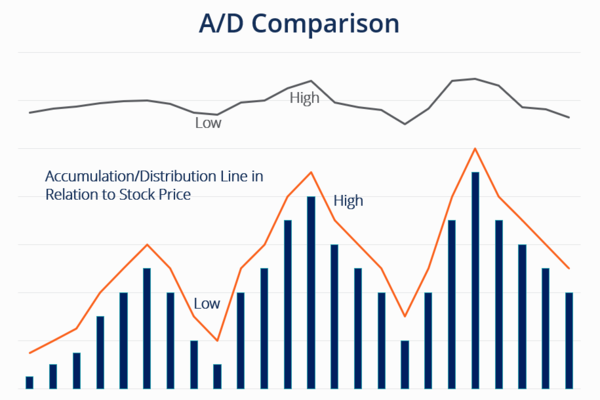
Moreover, volume analysis is crucial in confirming the pattern's validity. During the formation of an ascending triangle, trading volume often decreases as the price consolidates within the pattern. This reduction in volume indicates that market participants are waiting for a breakout before committing to new positions.
When the price finally breaches the resistance level, a surge in volume should accompany the move, confirming the breakout's legitimacy. If the breakout occurs with weak volume, the probability of a false breakout increases, and traders should exercise caution.
Trading Strategies for the Ascending Triangle Pattern
The most common approach is to enter a long position once the price breaks above the horizontal resistance level. Traders typically wait for a daily or four-hour close above resistance, accompanied by a volume spike, to confirm the breakout. Some traders prefer to enter immediately upon the breakout, while others wait for a retest of the previous resistance level, now acting as support, before initiating a trade.
Stop-loss placement is a critical component of trading the ascending triangle pattern. A logical stop-loss level is below the most recent higher low, as a break below this level would invalidate the pattern. Alternatively, traders can place a stop-loss a few percentage points below the breakout level to account for false breakouts and market fluctuations. The target price for the trade is typically measured by adding the triangle's height to the breakout level, providing a projected price objective.
As with our recommendation in other articles, we suggest using additional technical indicators to confirm the strength of the breakout. The Relative Strength Index (RSI) can help identify whether the asset is overbought or has room for further upside. If the RSI is above 70, it suggests the asset may be overextended, increasing the likelihood of a pullback. Conversely, if the breakout occurs with an RSI around 50-60, it indicates healthy momentum and a higher probability of sustained upside.
Adapting the Ascending Triangle to Different Timeframes

Furthermore, the ascending triangle pattern suits day traders, swing traders, and long-term investors. On shorter timeframes, such as the 15-minute or one-hour chart, traders can use the pattern to capture intraday breakouts, particularly in high-volume assets. Scalpers may prefer to trade smaller ascending triangles that form within broader market trends, taking quick profits as price moves toward predefined targets.
Swing traders typically look for ascending triangles on the four-hour or daily charts, aiming to hold positions for several days or weeks. These setups provide greater reliability and allow traders to take advantage of medium-term price movements.
Longer-term investors may find ascending triangles on weekly or monthly charts, signalling potential breakouts in fundamentally strong assets.
Real-World Examples of the Ascending Triangle
The ascending triangle has been observed in various financial markets, including stocks and forex. One notable example occurred in Apple Inc. (AAPL) stock, where an ascending triangle formed over several months. The stock repeatedly tested a horizontal resistance level while making higher lows, indicating strong buying pressure. Once the breakout occurred, accompanied by a surge in volume, AAPL rallied significantly, rewarding traders who identified the pattern early.
In the forex market, the EUR/USD currency pair has exhibited ascending triangle formations, particularly during periods of economic uncertainty. The pattern often precedes major breakouts when central banks announce policy changes or data releases.
Conclusion
In conclusion, the ascending triangle pattern is one of the most effective tools in technical analysis by offering traders a structured approach to identifying high-probability breakout opportunities.
As a final parting note, the key to successfully trading the ascending triangle pattern lies in waiting for confirmation, using proper stop-loss placement, and combining it with other technical indicators. Avoiding common mistakes such as entering too early, ignoring volume confirmation, or failing to set stop-loss levels is also crucial for long-term profitability.
Disclaimer: This material is for general information purposes only and is not intended as (and should not be considered to be) financial, investment or other advice on which reliance should be placed. No opinion given in the material constitutes a recommendation by EBC or the author that any particular investment, security, transaction or investment strategy is suitable for any specific person.