Published on: 2023-08-24
Updated on: 2024-05-06
Band trading is a short-term trading strategy aimed at utilizing short-term market fluctuations to generate profits. Band traders typically hold a trading position for hours or days, rather than holding it for a long time. They will look for short-term trends in the market and use technical indicators to assist them in making trading decisions. Compared to long-term investments, band trading places more emphasis on price dynamics and the utilization of short-term market trends to pursue short-term profits.
Technical indicators are tools used to analyze market prices and trading volume. They are based on historical data and help traders identify market trends and potential opportunities for price fluctuations through calculations and charts. Technical indicators can be divided into two categories: trend indicators and swing indicators.
| Swing Trading | Technical Indicators | |
| Definition | Short-term trading strategy, capitalizing on short-term market fluctuations | Tools for analyzing market prices and trading volume |
| Holding Duration | Holding for hours or a few days | No fixed holding duration |
| Trading Direction | Buying and selling based on short-term trends | No specific trading direction |
| Purpose | Leveraging price dynamics and short-term trends for quick profits | Assisting in identifying trends and potential price changes |
| Importance | Emphasis on price changes and market trends | Holds significant importance in analysis |
| Usage | Analyzing market trends, buy/sell timing, and price reversal points | Identifying market opportunities, trends, and price changes |
| Types of Indicators | Analysis based on historical price data | Categorized into trend and oscillation indicators |
| Examples | Using technical indicators to determine short-term trends and make trading decisions | Using Moving Averages, RSI, kdj, etc. |
| Limitations | Cannot solely rely on indicators for trading decisions | Cannot guarantee flawless predictive accuracy |
| Comprehensive Judgment | Requires considering other factors like market sentiment and fundamental analysis | Can enhance trading accuracy when used alongside other tools |
| Skill Requirement | Demands strong technical analysis skills and quick decision-making | Understanding indicators and incorporating market context |
| Objective | Pursuing short-term profits | Identifying market opportunities and trend shifts |
In band trading, technical indicators play an important role. Technical indicators are mathematical formulas or statistical indicators calculated based on historical price and transaction volume data. They help traders analyze market trends, identify price reversal points, and determine buying and selling opportunities. The following will explore in detail the relationship between band trading and indicators.
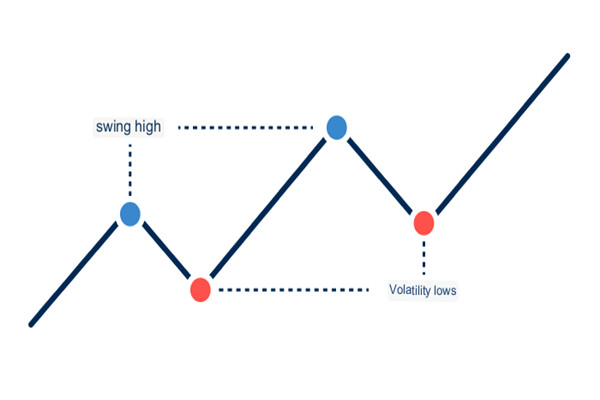
Firstly, band traders use technical indicators to analyze market trends. Trends are an important foundation for band trading, as only within the trend can there be opportunities for profit. Technical indicators can help traders identify whether the market is in an upward, downward, or consolidation stage. By analyzing trends, traders can choose the trading direction that is suitable for band trading, namely buying or selling.
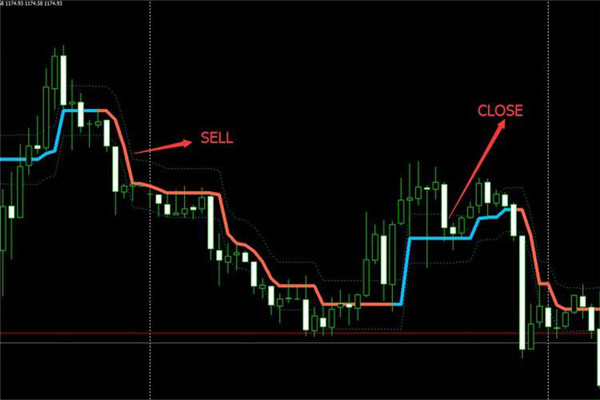
Secondly, technical indicators can also help band traders determine buying and selling opportunities. For example, the Moving Average is a commonly used technical indicator that smoothes price fluctuations by calculating the average price over a period of time. When the price crosses the moving average, it may be time to buy; when the price crosses the moving average, it may be time to sell. Other commonly used technical indicators include the relative strength index (RSI), the random index (KDJ), etc. They can provide overbought and oversold signals to help traders determine whether prices are too hot or too low and make corresponding buy or sell decisions.
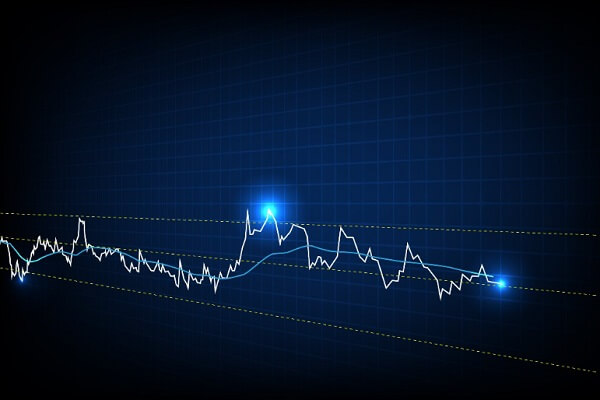
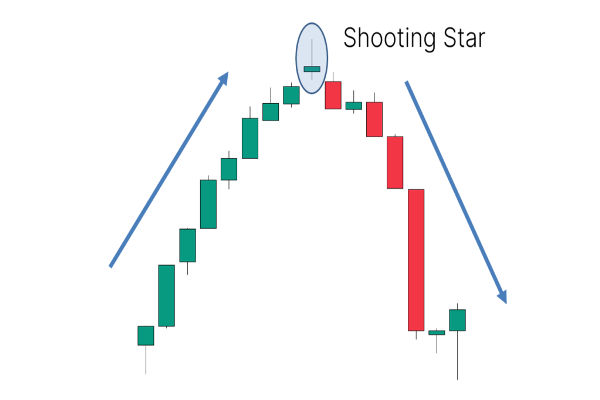
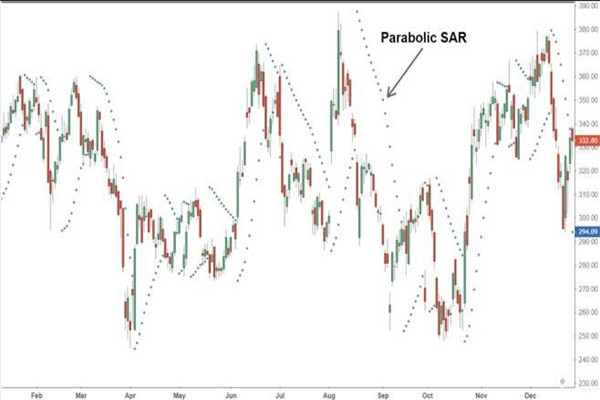
In addition, technical indicators can also be used to confirm price reversal points. Band traders hope to buy and sell near the price reversal point in order to gain profits. Technical indicators, such as trend lines and volatility indicators, can help traders identify the possibility of a price reversal. For example, when the Trend Line is broken or the volatility indicator shows excessive buying or selling, it may indicate that the price is about to reverse, and traders can adopt corresponding trading strategies at this time.
Band trading is closely related to indicators. As an important tool for band trading, technical indicators can help traders analyze market trends, determine buying and selling opportunities, and confirm price reversal points, thereby improving the accuracy and effectiveness of trading decisions. However, technical indicators are not perfect and cannot be relied solely on for trading decisions. Band traders still need to make comprehensive judgments based on other factors, such as market sentiment and fundamental analysis. In addition, band trading also requires traders to have high technical analysis ability and quick decision-making ability.
Disclaimer: This material is for general information purposes only and is not intended as (and should not be considered to be) financial, investment or other advice on which reliance should be placed. No opinion given in the material constitutes a recommendation by EBC or the author that any particular investment, security, transaction or investment strategy is suitable for any specific person.


World's Best Broker