In the world of technical analysis, few signals are as celebrated by bullish traders as the triple bottom pattern. It is known for its ability to signal a strong reversal after a prolonged downtrend, offering traders a potential entry before momentum shifts. However, not all patterns are created equal, and spotting the triple bottom pattern early can make a huge difference between entering too late and catching the move as it unfolds.
In this article, we will explore five reliable ways to identify the triple bottom pattern before it fully forms, helping you act with more confidence and precision in your trades.
How to Spot a Triple Bottom Pattern

1. Recognise the Structure of the Triple Bottom Pattern
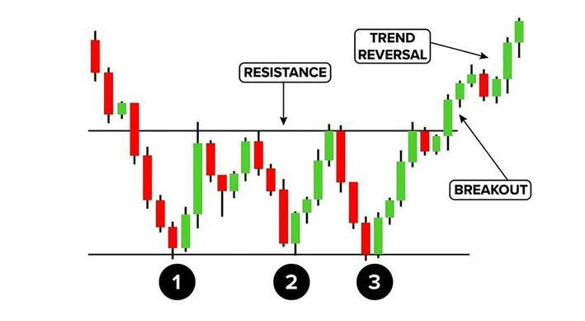
To catch the triple bottom pattern early, you need to know what to look for. The pattern consists of three distinct lows that occur roughly at the same price level, separated by two moderate peaks. This formation typically appears after a sustained downtrend and reflects a potential change in market sentiment.
The first low sets the stage, the second low indicates buying pressure is returning, and the third low confirms that sellers are losing control. Price usually breaks out above the resistance formed by the two interim highs, completing the pattern and signalling a new bullish trend.
If you can spot the second low starting to form and identify that it is respecting the support level established by the first low, you may be looking at the early stages of a triple bottom pattern.
2. Use Volume to Confirm the Pattern's Strength
Volume plays a crucial role in confirming any chart pattern, including the triple bottom pattern. In its early stages, declining volume is common as the downtrend loses strength. However, as the third low forms and price begins to move upward, rising volume can indicate that buyers are stepping in with real conviction.
An early increase in volume after the second or third low can be a reliable clue that the pattern is developing. If volume spikes as price approaches the neckline — the resistance line drawn across the two interim highs — this adds more credibility to the pattern.
Watching volume closely can help you filter out false signals and improve your chances of identifying the triple bottom pattern before the breakout.
3. Check Momentum Indicators for Divergence
Momentum indicators such as the Relative Strength Index (RSI) or Moving Average Convergence Divergence (MACD) can provide early hints that a triple bottom pattern may be forming.
For example, if the price makes three lows at the same level, but RSI shows higher lows each time, this is called bullish divergence. It suggests that while price action remains flat, underlying strength is building. Similarly, a bullish crossover on the MACD during or after the third bottom can confirm a potential shift in momentum.
By combining candlestick structure with momentum analysis, traders can improve their ability to identify the triple bottom pattern early and with greater confidence.
4. Observe Time and Symmetry
Patterns that are too skewed in terms of time or spacing between bottoms are less reliable. The triple bottom pattern tends to follow a relatively symmetrical structure, where each of the three lows occurs over a similar time frame and with similar depth.
If you notice that the first two lows were weeks apart and the third appears too soon or too late, caution is warranted. A balanced structure adds to the credibility of the pattern and can help you distinguish it from random price action.
Symmetry adds order to chaos. A consistent shape and timeframe are often the earliest clues that what you are seeing is not just noise but a developing triple bottom pattern.
5. Use the Neckline as a Reference Point
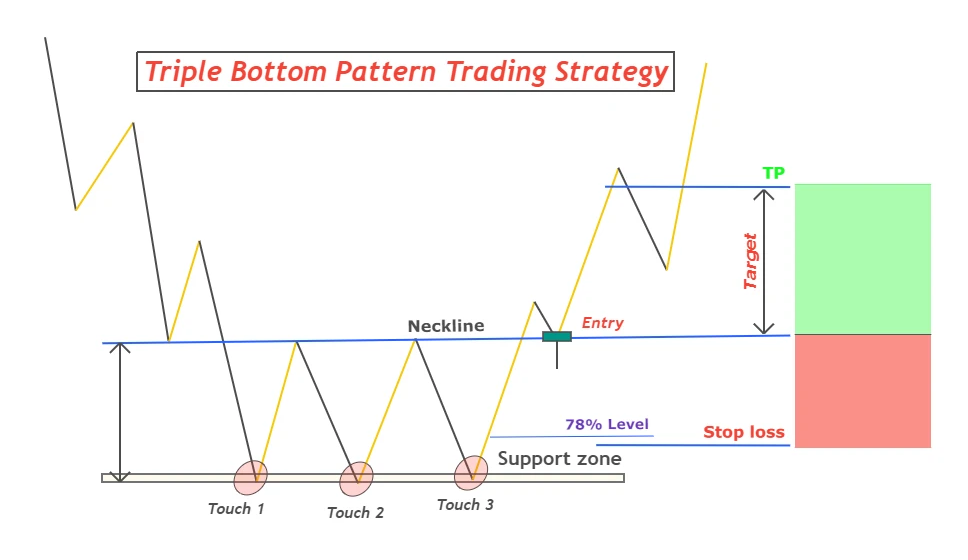
Even before the triple bottom pattern is confirmed, the neckline — which connects the highs between the bottoms — serves as a critical resistance level. As the third bottom begins to rise, keep your eye on how price behaves near the neckline.
If price struggles to break the neckline but does not retreat too far, and volume remains steady or increases, this could be a sign of consolidation before a breakout. Traders who recognise this setup may enter positions before the breakout, using tight stop-losses just below the final bottom.
Using the neckline as a guide for breakout anticipation allows you to be proactive rather than reactive when trading the triple bottom pattern.
Trading the Triple Bottom Pattern Safely

Although spotting the triple bottom pattern early has its benefits, it also comes with risks. Premature entries can lead to losses if the pattern fails to complete. That is why many traders wait for a confirmed breakout above the neckline before committing to a position.
A common trading strategy is to enter on the breakout with a stop-loss just below the third bottom and a target equal to the distance between the neckline and the bottom. This measured approach helps manage risk while taking advantage of potential upward momentum.
Even when recognised early, the triple bottom pattern should be used alongside other technical indicators, including support and resistance zones, moving averages and volume analysis.
Final Thoughts
The triple bottom pattern is a powerful tool for traders looking to catch bullish reversals before the rest of the market reacts. By learning to spot the early signs — from structure and volume to momentum and symmetry — you can position yourself for smarter, more informed trades.
Always remember that no pattern is foolproof. The triple bottom pattern offers a high-probability setup, but confirmation and proper risk management are essential for long-term success. Mastering this pattern will not only improve your chart reading but will also boost your confidence in navigating market reversals with clarity and purpose.
Disclaimer: This material is for general information purposes only and is not intended as (and should not be considered to be) financial, investment or other advice on which reliance should be placed. No opinion given in the material constitutes a recommendation by EBC or the author that any particular investment, security, transaction or investment strategy is suitable for any specific person.


