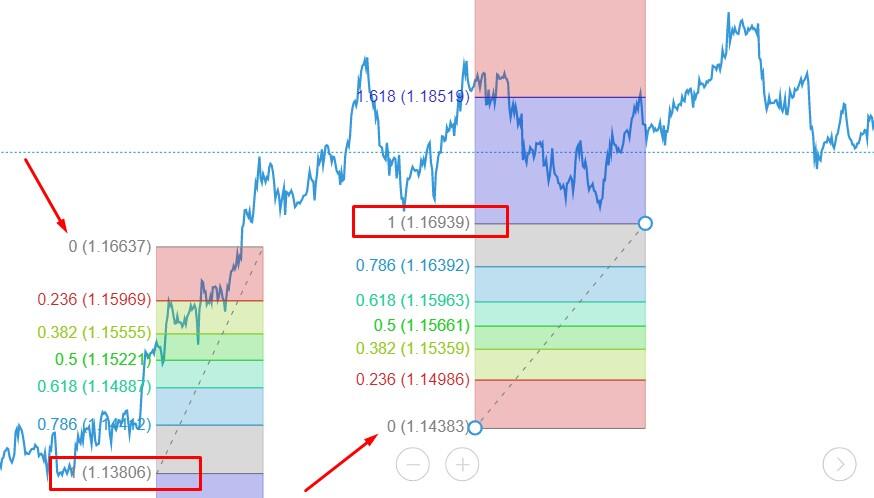
The Fibonacci pullback theory is one of the classic theories commonly found in stocks, which is a trend line established between two endpoints. The Fibonacci withdrawal theory is based on Fibonacci LeonardoFibonacci discovered the logical inference of numbers, which means that each subsequent data is the sum of the first two numbers: 1, 1, 2, 3, 5, 8, 13, 21, 34, 55, 89, 144, and so on.

Each data is approximately 1.618 times that of the previous data, and each previous data is 0.618 times that of the subsequent data. This tool is created using two points on the determined trend line. Then draw 9 horizontal lines, Fibonacci level: 0.0%, 23.6%, 38.2%, 50%, 61.8%, 100%, 161.8%, 261.8%, and423.6% crosses the trend line.
Application examples
Fibonacci retracement is drawn, for example, by reversing from the lowest point to the two endpoints on the highest point line. Then draw 9 horizontal lines that intersect the Fibonacci levels of 0.0%, 23.6%, 38.2%, 50%, 61.8%, 100%, 161.8%, 261.8%, and 423.6% with the trend line. When there is a significant increase or decrease online, prices often return to their previous levels to correct some basic parts (sometimes all) of their initial dynamics. In such an interactive trend, the Fibonacci pullback price is often at the same level as or near the support/resistance point.
Using Fibonacci pullback to improve your Moving Average is very helpful for your judgment: when the stock price drops, if the 23.6 line cannot be supported, do not rush to make up, as it has a high probability of seeking the next line, the 38.2 line, downwards. If you need to make up, you need to wait until the 23.6 line has support, otherwise it should be more suitable to enter near the 38.2 line. But if the 38.2 line still doesn't hold up, then wait for the next line, and so on. On the contrary, when rebounding, if it can break through the upper line, it can be seen as high (usually with a pullback confirmation process). If you cannot break through, turn around and sell.
【 EBC Platform Risk Reminder and Disclaimer 】: There are risks in the market, and investment needs to be cautious. This article does not constitute investment advice.


