Published on: 2023-07-03
Updated on: 2024-06-05
Real-time trading volume refers to the total trading volume of all commodities, stocks, currencies, or other assets in the market during a specific time period. It reflects the level of market activity and the level of interest of traders in a particular asset.

Real-time trading volume is usually used to measure market liquidity. When the trading volume is high, it means that there are a large number of purchase and sale orders submitted in the market, there are more assets available for trading, and the trading execution speed is faster. On the contrary, when trading volume is low and market liquidity is low, trading execution may be slower.
Real-time trading volume can also provide useful information, such as the emotions and trends of market participants. A higher trading volume may indicate that market participants have a strong interest in a particular asset and may represent an upward or downward trend in the market. A lower trading volume may indicate a lower interest among market participants in assets, which may represent a sideways or wait-and-see trend in the market.
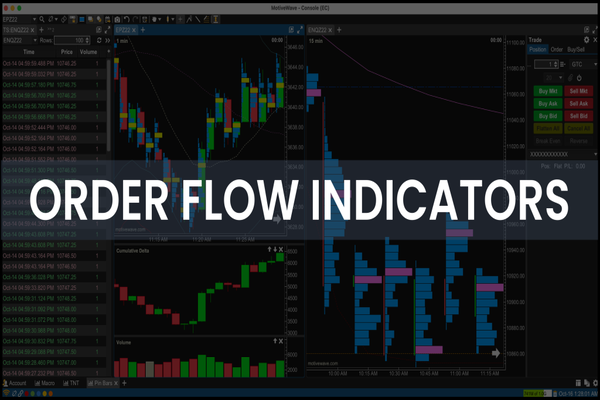
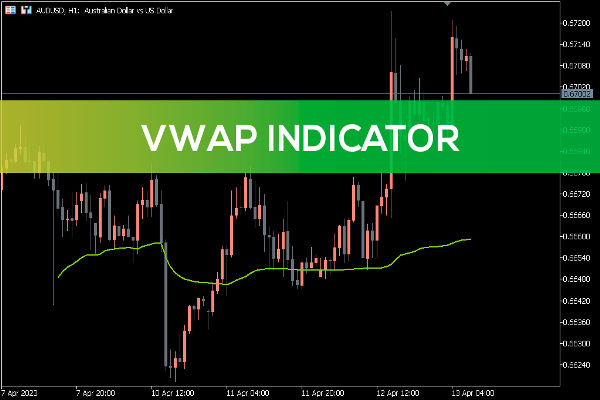
The statistical data of trading volume can be displayed through charts and indicators, such as trading volume bar charts and trading volume weighted averages. These tools can help traders analyze market trends and make corresponding trading decisions.
Real-time trading volume is not a single indicator but an important piece of data in the financial market. It is usually used in conjunction with other indicators to provide a more comprehensive basis for market analysis and trading decisions. For example, investors and traders may conduct comprehensive analysis based on real-time trading volume, price trend, trading volume, trading volume, trading volume, and other indicators to better understand the supply and demand relationship, trading activity, and Market trend of the market.
At the same time, real-time trading volume can also be combined with other behavioral and emotional indicators of market participants, such as investor sentiment indices and market volatility indicators, to comprehensively evaluate market risks and opportunities. Therefore, real-time trading volume is often used in conjunction with other indicators in market analysis and trading decisions to provide more accurate market judgments and trading strategies.
A common trading volume indicator is trading volume, which represents the number of trade during a specific time period. Trading volume can display the level of market activity and compare it with price trends, helping to determine market trends and changes.
In addition, there are other trading volume indicators, such as the relative strength index (RSI), trading volume bar chart, accumulation/distribution line, etc. These indicators are calculated and analyzed based on trading volume data to provide more market information and Trading signals.
In short, real-time trading volume refers to the sum of all trading volumes in the market during a certain period of time, reflecting market activity, asset liquidity, and the level of interest of traders. Different trading markets and platforms may have their own trading volume indicators, so the specific indicator used needs to be determined based on the actual situation.


World's Best Broker