Today, EBC Finance shares with you the insights and insights of Christopher J, a Wall Street trader, on investment and decision-making. Christopher J worked for Jane, a top trading company on Wall StreetStreet and Optiver, currently engaged in the field of artificial intelligence health.
As soon as I graduated from college, I started my trading career at an electronic hedge fund on Wall Street. After several interviews, I was fortunate enough to receive Jane Street, Optiver, and IMCWaiting for offers from top companies.

My main role there is as a market maker. In order to better understand market makers, I will give you an analogy. Suppose you want to purchase goods such as apples. You need to find an apple seller and negotiate a fair price. Market makers are intermediaries who are always willing to buy or sell at a given price to make the buying and selling process more efficient.
In financial terminology, this means providing liquidity for financial transactions. At any specific moment, you can close your position in exchange for cash. In terms of scale, these companies process billions of dollars annually.
Working at these Wall Street trading institutions has caused a disruptive change in my thinking. It not only taught me a lot of technical knowledge, but also shaped me into a self driven, independent thinking, and hardworking person. Anyone who enjoys solving problems can try trading. You don't need a background in mathematics or finance to participate.
Trading culture is similar to professional sports. This is a zero sum game with clear winners and losers - you either make money or lose money.
This means that your salary and job security are highly dependent on your performance. A trader's roughly distributed salary based on performance is approximately one tenth of the NBA's annual salary.
The design of algorithmic trading into complex quantitative models always gives people a sense of mystery. But in fact, algorithmic logic is not difficult. It is rooted in some basic principles of all trading strategies, which are applicable to everyone. I share the quantitative strategies used by four Wall Street traders.
Positive Expectation Betting

The way traders make money is similar to the way casinos accumulate favorable odds for them.
Imagine flipping a coin. If it falls on the front, you will win $3; if it falls on the back, you will lose $1USD. If you only flip a coin once, you may have bad luck and lose all your money. However, in the long run, if you set your expectations to earn 1 every time you flip a coinThe positive return of the US dollar. So this is called positive expectation betting. In the time span of millions of transactions, you can almost guarantee profits.
This exact principle tells you why you should never play roulette in a casino. Because these games are all bets with negative expectations, in the long run, this will ensure that you will definitely lose money. Of course, there are exceptions, such as poker or blackjack. (21)Point is the most likely game to win money in the casino, and it is also the only relatively fair game there. With the best gameplay adopted, the player's winning rate is as high as 49%
Do you know why the banker always wins? This statement comes from a term: house advantageEdge). Banker advantage refers to the expected percentage of return that a casino can receive from each bet made by a gambler. In short, the banker's advantage is the "true odds" and "payoutThe gap between ODDS.
The definition of true probability is the likelihood of an event occurring. For example, the real probability of a roulette game is 1 in 38.
The odds refer to the ratio that the casino will pay if an event occurs (such as someone winning). For example, the odds of a roulette game would be 1 out of 35.
Casinos make money by the difference between real odds and odds. Therefore, even if a player wins a big prize, in the long run, the casino will still be the winner.
Now back to what we call positive expectation betting, Wall Street traders often evaluate and measure their expectations before trading. At this time, we will talk about a very famous formula, also known as the "Kelly criterion", which was established by John Kelly, a scientist at Bell LabsDeveloped in 1956, this formula calculates the ratio of a person's net asset to their bet to maximize the expected number of wealth growth (i.e. geometric growth rate).
Kelly's Criterion
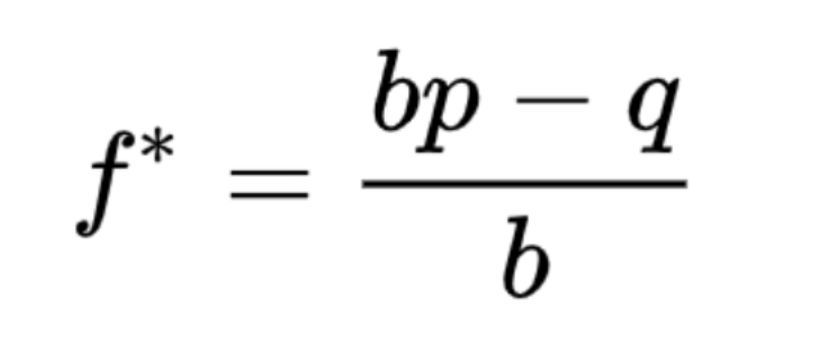
On the left side of the equation, f * is the percentage of total wealth that we should place at risk. On the right, p is the probability of winning, q=1-p is the probability of losing, and bIt is the odds (i.e. the ratio of the amount we will win to the amount we will lose).
For many traders, finding market opportunities becomes much easier compared to the issues of position size and risk management.
However, you need to remember that the correct trading is 90% capital and portfolio management.
In other words, a trader with mediocre strategies and a strong risk model can achieve success. Traders with excellent strategies and mediocre risk models are bound to fail.
According to Kelly's formula, we can derive an optimal investment position ratio to maximize long-term cumulative returns:
Bet=edge/odds=expected revenue/return on revenue
The edge here can be understood as the probability of winning * probability - probability of failure. When the edge number is positive, it is a trade worth betting on, and the edge is 0Or negative numbers indicate that there is no edge and betting should not be done.
Relative Price Strategy
When two varieties have a clear causal relationship, relative price is a good strategy. Let's imagine having an apple and a box of apple juice. Assuming there is a causal relationship, that is, cardboard boxes are always 9% more expensive than applesUSD. The current transaction prices for apples and cardboard boxes are $1 and $10, respectively.
If the price of apples rises to 2USD, the price will not be immediately reflected on the cardboard box. There will always be a time difference. We cannot determine whether Apple is trading at fair value or overpriced. So how can we utilize this situation?
If we buy the cardboard box for $10 and sell the apple for $2, we actually purchase the "price difference" for $8. Due to causal relationships, the price difference is reasonably valued at 9USD, which means we earned 1 USD. The reason why high-frequency trading companies are so concerned about nanosecond delays is actually to be the first to discover these relatively incorrect pricing.
Michael LewisLewis' "Lightning Boy" tells the story of how high-frequency trading companies use ultra high-speed fiber optic cables to connect the financial markets of New York and Chicago for arbitrage trading. This $300 million cable takes data transmission time from17 milliseconds shortened to 13 milliseconds. This advantage enables high-frequency companies to obtain better prices than their competitors in their transactions.
Common investment varieties for mutual trading include ETFs and reverse ETFs, a certain stock and ETFs containing that stock, or synthetic option structures.
Relativity
Correlation is the mutual connection between two things. When they develop in the same direction, they are called positive correlations, and vice versa, negative correlations.
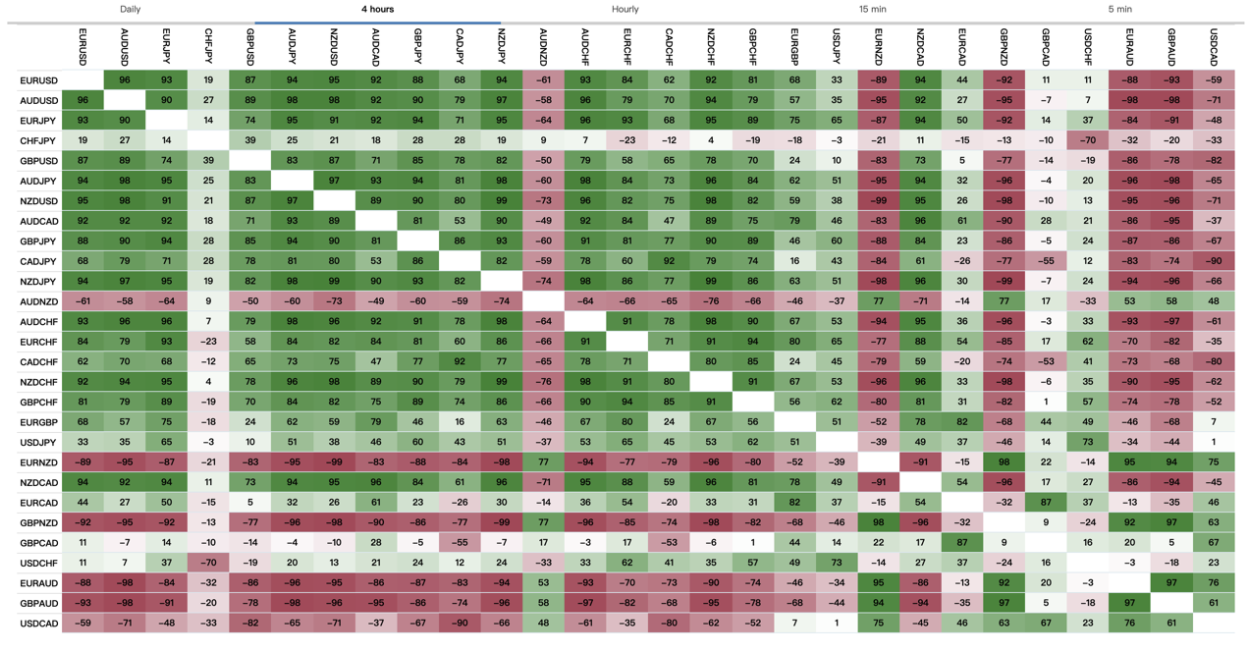
Many times, certain correlations do not have an intuitive reason, but they are still valid. The legendary Renaissance technology company screened hundreds of trillions of bytes of historical data in search of profitable signals.
For example, good morning weather in a city often indicates an upward trend in its Securities market. In theory, it is possible to buy stocks at the opening and sell them at noon to make a profit.
An important suggestion is to ignore any retail traders who sell trading systems to you. These are all scams. At best, these are bottom signals, with almost no profit after removing transaction costs.
Mean Regression
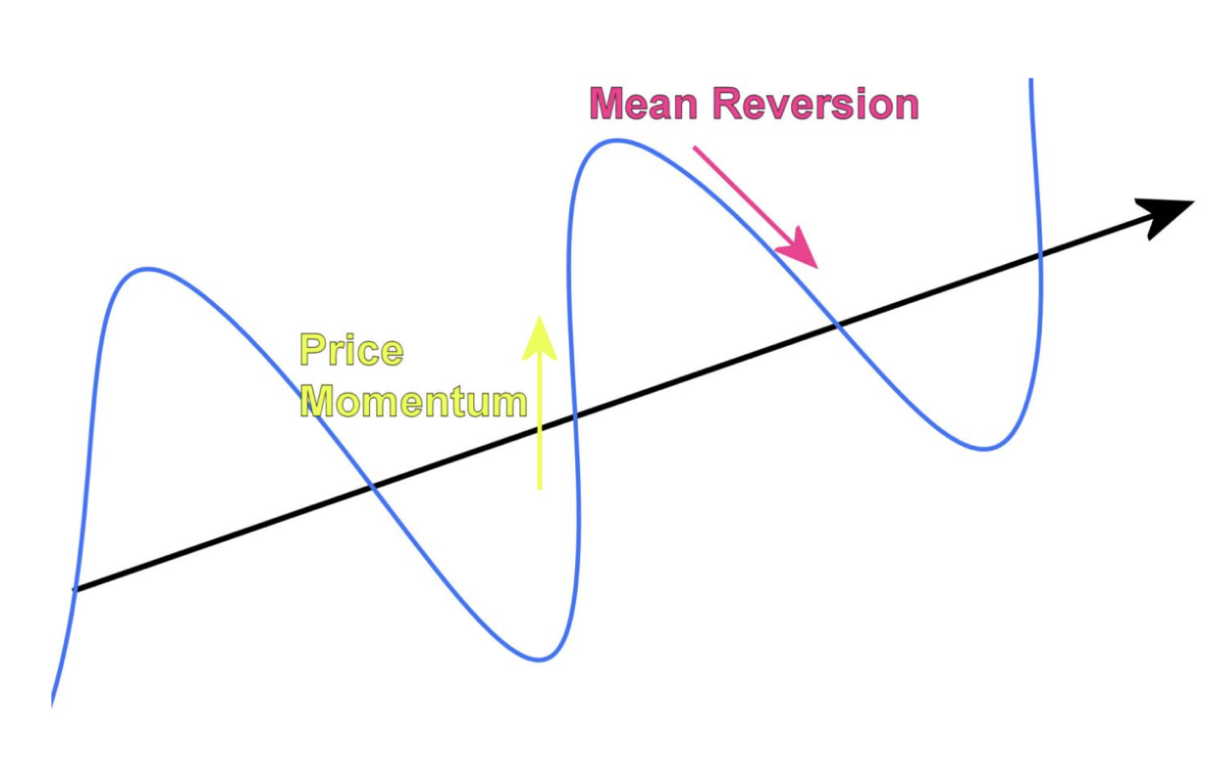
Another common strategy for Wall Street traders is mean regression. The mean regression theory is the foundation of many trading strategies that involve buying and selling asset class prices that deviate from historical averages.
In the field of options, the main focus is on buying volatility when it is below historical value, and vice versa.
Purchase options are essentially synonymous with purchasing volatility. Of course, the actual operation is not so simple.
For most people, the most applicable mean regression trend is interest rates. These often fluctuate up and down, depending on whether the central bank adopts stimulus or tightening policies.
Currency never rises or falls in a straight line against prices, even in the strongest trends, the rise or fall of prices are alternating. For example, in a strong upward trend, after a sharp rise in prices, they generally retreat and then continue the upward trend.
Mean regression is not only applicable to asset prices. It can also be applied to volatility, returns, growth rate of returns, and technical indicator levels.
Mean regression is a useful market concept that needs to be understood, but it does not guarantee that transactions will be profitable every time. Although prices do indeed recover to the average over time, we cannot predict when this will happen in advance. The price may continue to deviate from the average for a longer period than expected.
In addition, the direction of the trend may change, or the magnitude of price changes may also change. Just because the price rises does not mean it will fall to the mean; The average may also increase to meet prices.
Due to these unknown factors, Wall Street professional traders have strict risk management measures. Set an Exit Strategy where if the price does not move in their expected direction, their position will be liquidated at that point, helping to minimize losses as much as possible.


