Published on: 2025-06-04
Updated on: 2026-03-24
Candlestick charts are one of the most widely used tools in technical analysis, and for good reason as they provide powerful visual signals that help traders make smarter decisions.
Among the many patterns traders look for, the Red Hammer candlestick stands out as a potential indicator of a bullish reversal. But what does this pattern tell you? How reliable is it? And how should traders incorporate it into their strategies?
In this detailed guide, we'll cover everything you need to know about the Red Hammer candlestick, including its formation, pros and cons, real-world examples, and trading strategies.

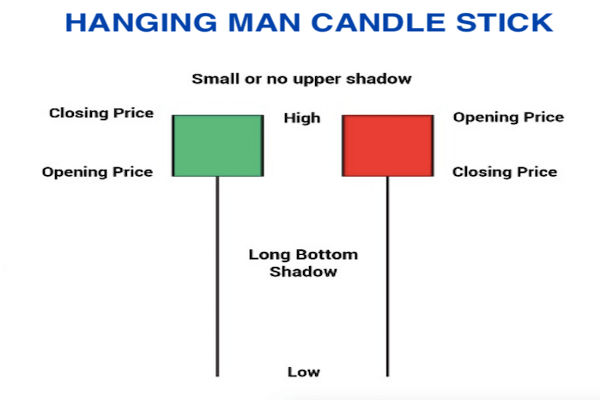
The Red Hammer is a type of hammer candlestick pattern that signals a potential bullish reversal, typically appearing after a downtrend. It gets its name from its appearance and colour:
Hammer-like shape: It has a small body and a long lower wick (or shadow), usually at least twice the height of the body.
Red or bearish close: The candle's body becomes red after it closes below the open.
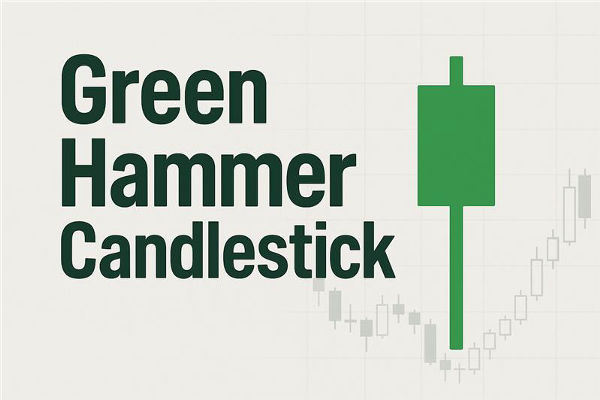
While a Green Hammer (bullish hammer) is often considered a stronger signal, a Red Hammer can still indicate buyer strength, especially if confirmed by subsequent price action.
| Component | Description |
|---|---|
| Color | Red (bearish close) |
| Body Size | Small |
| Lower Wick | Long, typically 2x or more the size of the body |
| Upper Wick | Minimal or none |
| Location | Appears after a downtrend |
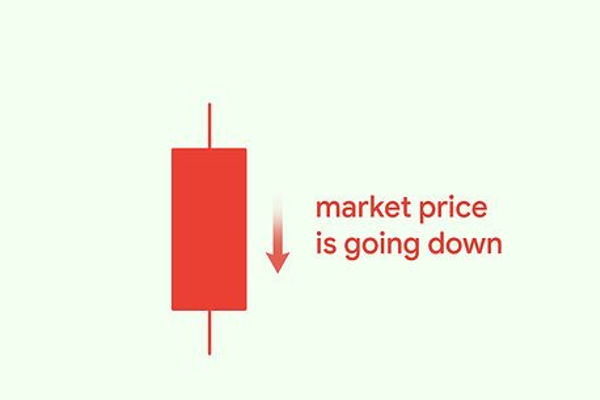
The Red Hammer signals that although sellers initially dominated, buyers entered the market later in the session, pushing prices back up significantly from the low. This shift signals potential bullish momentum.
Buyer interest is emerging
Sellers are losing control
A possible trend reversal may be on the horizon
However, since the candle closes red, it also shows that buyers weren't strong enough to close the session higher. Therefore, it should be considered a weaker bullish signal than a green hammer.
| Feature | Red Hammer | Green Hammer |
|---|---|---|
| Closing Price | Below open (bearish) | Above open (bullish) |
| Buyer Strength | Moderate | Stronger |
| Bullish Reversal Signal | Weak to moderate | Moderate to strong |
| Ideal Confirmation | Strong green candle after | Immediate follow-through candle |
It often appears before a trend reversal, helping traders enter early.
The shape is visible on charts, even for beginners.
You can use it on daily, weekly, or even intraday charts such as 5-minute or 1-hour intervals.
When it appears at a known support zone or Fibonacci retracement, its reliability improves significantly.
Being a pattern with clear highs and lows, it allows for precise placement for stop-loss.
Since it closes lower, it shows buyer hesitation. A strong follow-up candle is necessary to validate the signal.
Without volume confirmation or appearing in the wrong context (e.g., sideways market), it can lead to false positives.
How long should the wick be? How small should the body be? These questions can vary from trader, leading to inconsistency.
It shouldn't be used in isolation. Successful traders pair it with trend analysis, volume data, and other indicators such as RSI or MACD.

Make sure the price has been declining for at least a few sessions.
Look for a candle with a small red body and a long lower shadow.
Is it near a support zone?
Are indicators like RSI showing oversold?
Was there a high volume?
A strong, bullish candle following the Red Hammer adds confidence.
Entry: After confirmation, usually above the high of the Red Hammer.
Stop-loss: Below the low of the Red Hammer.
Target: Recent resistance levels or use risk-to-reward ratios (1:2 or 1:3).
| Indicator | How It Helps |
|---|---|
| Volume | Confirms whether buyers are entering strongly |
| RSI | Oversold conditions make the reversal more likely |
| MACD | A bullish crossover near a Red Hammer adds confluence |
| Fibonacci | Pattern at 61.8% retracement zone is highly reliable |
| Bollinger Bands | A Red Hammer outside lower band signals a likely bounce |
In mid-2022, AAPL was in a downtrend when a Red Hammer appeared at the $140 support level. The next day, a bullish engulfing candle confirmed the reversal, and the price rallied to $160.
During a dip in early 2023, a Red Hammer formed near a 50% Fibonacci retracement on the 4-hour chart. The following candles confirmed the move, and the price was reversed by over $40.
On a 1-hour chart, EUR/USD printed a Red Hammer near a key horizontal support. With RSI under 30 and MACD preparing to cross, traders entered long. A strong green candle confirmed the bounce.
It is a bullish reversal pattern that appears after a downtrend. It has a small body at the top of the price range (where the closing price is lower than the opening) and a long lower wick (usually at least twice the length of the body).
No, a green hammer (where the close is above the open) is considered a stronger bullish signal because it shows total buyer control. A red hammer means some residual selling pressure remains, so it requires stronger confirmation.
It is not very reliable. A red hammer in isolation can produce false signals. It should always be used in combination with other tools (support levels, RSI, trendlines).
The most reliable red hammers appear after a long, sustained downtrend and specifically at a known support zone or previous low.
In conclusion, the Red Hammer candlestick is a valuable early warning that a downtrend may be ending. While not as strong as its green counterpart, it still reflects crucial market psychology and potential reversals, especially when used correctly.
Like any pattern, its success rate depends on context and discipline. When used wisely, the Red Hammer can help you catch turning points before the crowd notices.
Disclaimer: This material is for general information purposes only and is not intended as (and should not be considered to be) financial, investment or other advice on which reliance should be placed. No opinion given in the material constitutes a recommendation by EBC or the author that any particular investment, security, transaction or investment strategy is suitable for any specific person.