In the world of trading, chart patterns are essential for identifying potential market reversals. Among the most commonly discussed patterns are the Quasimodo pattern and the Double Top. While both signal potential trend reversals, these two patterns have distinct characteristics that every trader should understand.
In this article, we'll compare the Quasimodo pattern to the Double Top, highlight their key differences, and show you how to spot them in the market.
What Is the Quasimodo Pattern?

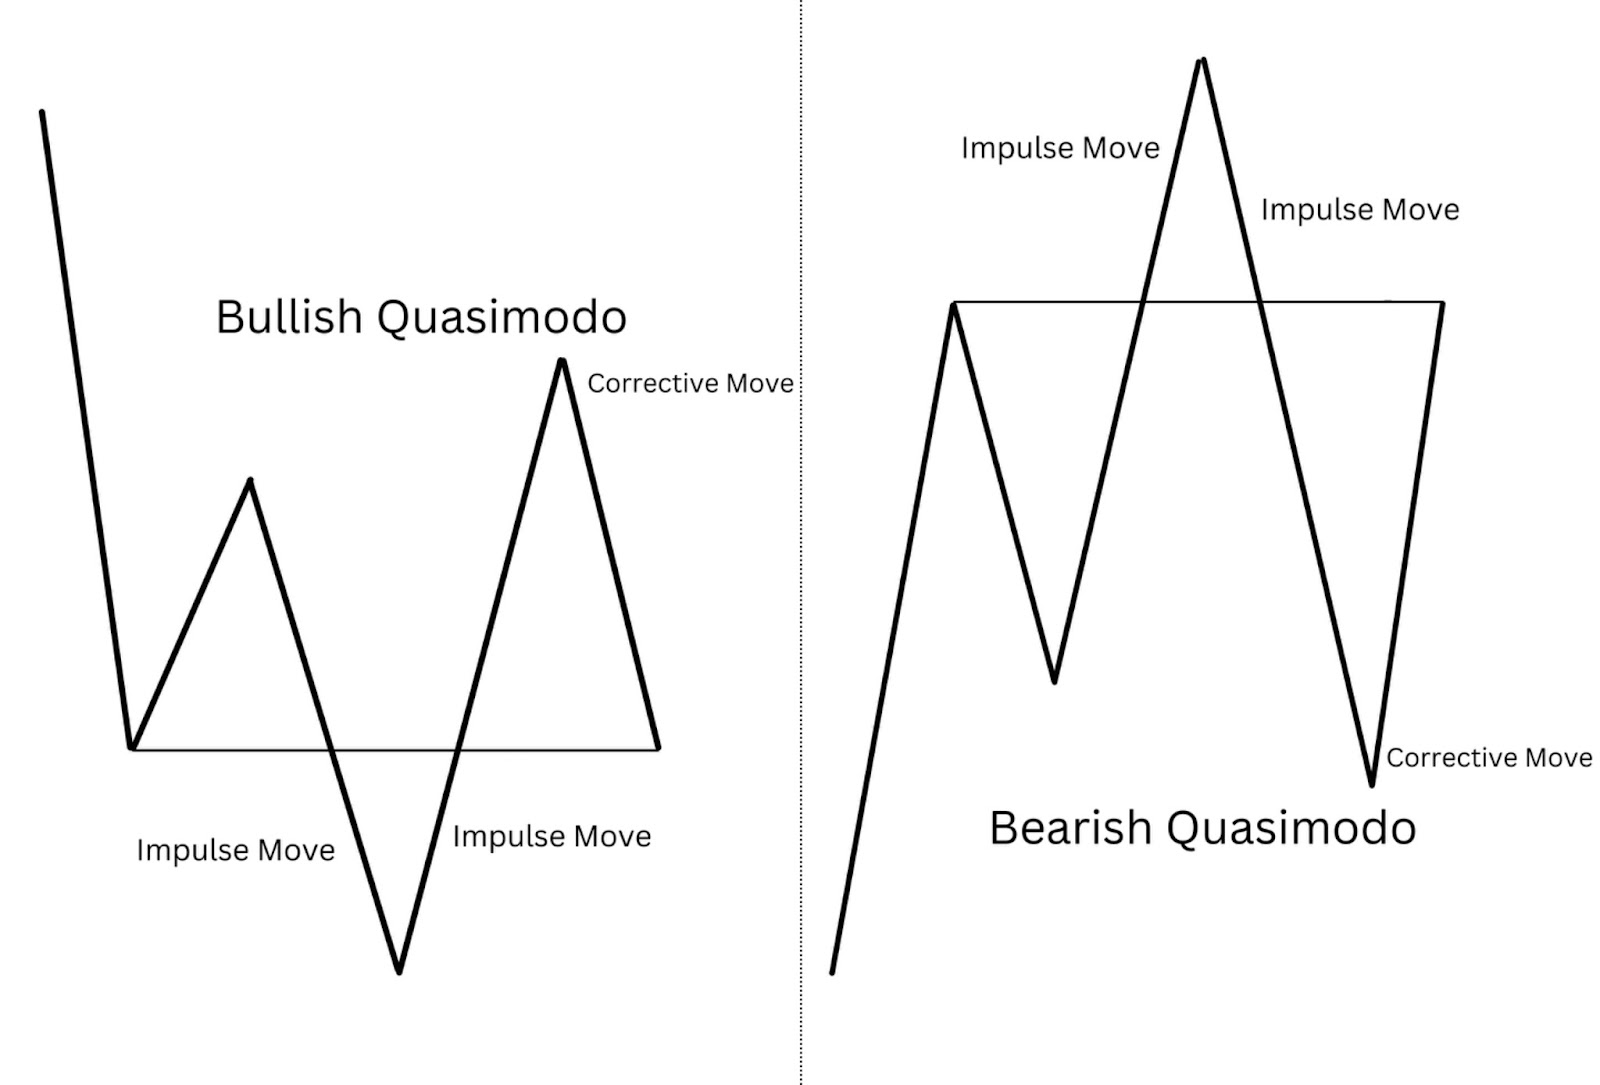
The Quasimodo pattern, also known as the "MQ" pattern or "m-shaped" reversal, is a chart formation that indicates a potential change in the direction of an asset's price. This pattern is characterised by a distinctive "double peak" formation that looks somewhat like a sideways "M" shape. The Quasimodo pattern usually forms after an uptrend and signals a potential reversal to the downside.
The first feature of the Quasimodo pattern is the creation of a peak followed by a pullback. After the initial peak, the price forms a second peak, but this peak is slightly lower than the first, which gives the pattern its unique appearance. A key aspect of this pattern is the neckline, which is a significant support level beneath the second peak. The pattern is confirmed when the price breaks below this neckline, signalling the potential for a trend reversal.
What Is the Double Top Pattern?
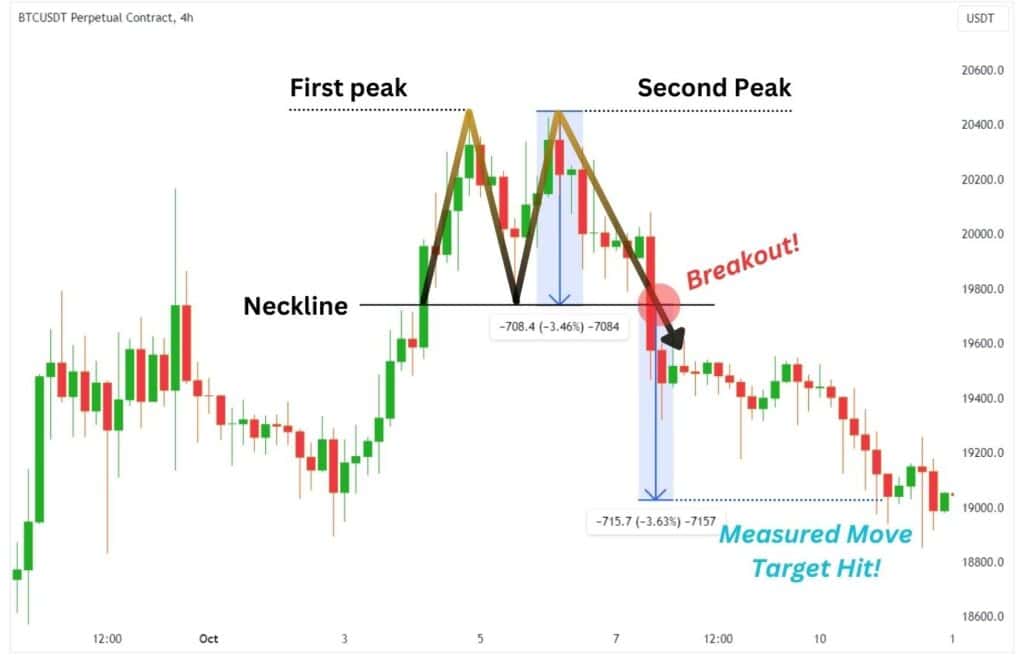
The Double Top pattern is another reversal chart pattern that signals a potential shift in price direction. As the name suggests, it consists of two peaks that occur at approximately the same price level, forming a shape that resembles the letter "M."
Like the Quasimodo pattern, the Double Top begins with the price rising to a new high, followed by a slight pullback. The price then rises again, forming a second peak that is nearly equal to the first. The pattern is confirmed when the price breaks below the neckline, which is the support level connecting the two troughs between the peaks.
While the Double Top pattern is widely recognised and popular among traders, it can sometimes be less reliable than the Quasimodo pattern because both peaks are often very similar in height, making it harder to confirm the reversal signal.
Key Differences Between the Quasimodo Pattern and Double Top
While both the Quasimodo pattern and the Double Top indicate a potential trend reversal, there are several important differences between the two patterns.
The first key difference lies in the formation shape. The Quasimodo pattern typically forms an "M" shape, but the second peak is slightly lower than the first. This creates a more distinctive structure, making it a more reliable signal of a reversal. In contrast, the Double Top pattern has two peaks that are nearly equal in height, which can sometimes make it harder to spot.
Another significant difference between the two patterns is the neckline. The neckline in the Quasimodo pattern is usually a key support level beneath the second peak. This is in contrast to the Double Top, where the neckline is more horizontal, connecting the two lows between the peaks. The breakdown below the neckline in both patterns confirms the reversal, but the slope of the neckline in the Quasimodo pattern often gives it more significance.
When it comes to reliability, many traders consider the Quasimodo pattern to be more reliable than the Double Top. This is because the Quasimodo pattern typically occurs after a strong uptrend, and the second peak being lower than the first is seen as a sign of market exhaustion. The Double Top, on the other hand, can sometimes be less definitive, as both peaks are similar in height, making it harder to gauge the strength of the reversal.
The trend context is also an important factor. The Quasimodo pattern usually forms after a strong uptrend, where the price creates higher highs before forming the second peak. This is often a sign of market exhaustion, where buying pressure begins to fade. In comparison, the Double Top forms when the price attempts to make a higher high but fails to do so, indicating a potential slowdown or reversal.
How to Trade the Quasimodo Pattern
To trade the Quasimodo pattern, it's essential to wait for confirmation before taking action. After identifying the two peaks with the second peak being lower than the first, traders should look for the price to break below the neckline, which connects the support levels beneath the peaks. This breakdown confirms the pattern and signals a potential reversal.
Once the breakdown occurs, traders often enter a short position, anticipating that the price will continue to move lower. Stop-loss orders are typically placed above the second peak to limit potential losses in case the reversal fails to materialise. Traders can set their price target based on the distance between the peaks and neckline, aiming to capture a portion of the expected price movement.
How to Trade the Double Top Pattern

The Double Top pattern is relatively straightforward to trade, but, like the Quasimodo pattern, it requires confirmation before entering a position. After identifying two peaks of nearly equal height, traders should wait for the price to break below the neckline, which connects the valleys between the two peaks. This confirms the reversal and provides an entry signal.
Similar to the Quasimodo pattern, traders enter a short position once the price breaks below the neckline, with stop-loss orders placed above the second peak to protect against unexpected price movements. The target for this pattern is also based on the distance between the peaks and the neckline, giving traders a clear price target to aim for.
Conclusion
Both the Quasimodo pattern and the Double Top are powerful reversal signals that traders can use to anticipate changes in market direction. While they share some similarities, the key differences lie in their formation, reliability, and the context in which they appear.
The Quasimodo pattern is often seen as a more reliable reversal signal due to its structure, where the second peak is lower than the first. However, the Double Top is still a widely used pattern and can be effective when combined with other technical analysis tools.
Understanding how to spot and trade these patterns can give traders a significant advantage in the market. By waiting for confirmation and managing risk appropriately, you can increase your chances of success when trading the Quasimodo pattern or the Double Top.
Disclaimer: This material is for general information purposes only and is not intended as (and should not be considered to be) financial, investment or other advice on which reliance should be placed. No opinion given in the material constitutes a recommendation by EBC or the author that any particular investment, security, transaction or investment strategy is suitable for any specific person.


