Gap jumping is a common technical form that can occur in stock, forex, and futures markets.
Compared to other indicators, short gaps are easier to identify and are a great trading opportunity for most traders, and the operation is also very simple. Study it carefully and you can make very good profits.
So today's article will comprehensively explain the basic knowledge and trading skills of gap jumping, which I believe will be helpful to everyone.
1. What is a Jump Gap?
The manifestation of the gap in the chart is that there is a discontinuous quote with a blank space between the two k lines. Please take a look at the schematic diagram below.
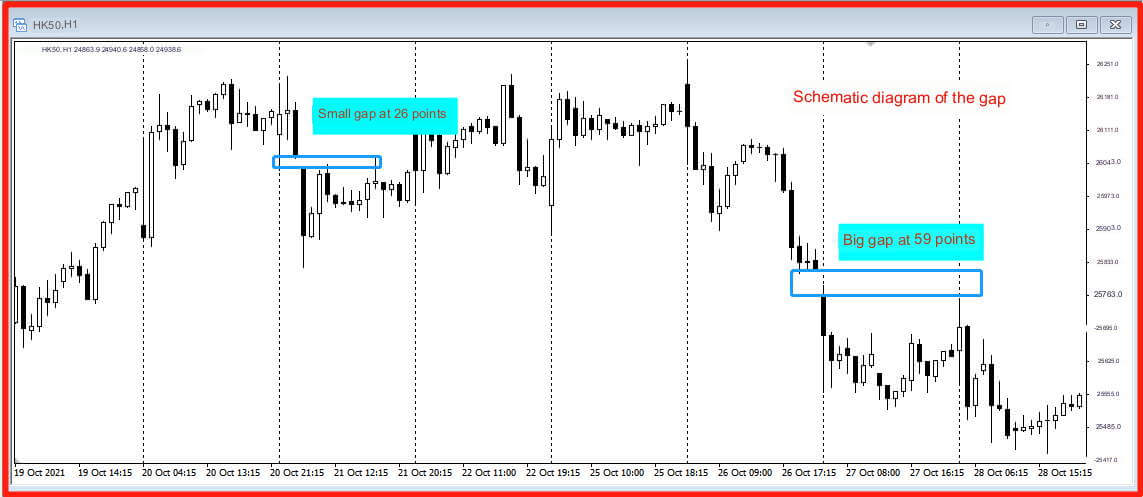
The blue rectangle in the figure is the gap where the k line jumps.
Most of the time, the quotation of the market is continuous, and the k line also bites its tail to rise or fall.
The K-line is the performance of prices on charts, and there are two reasons for the formation of gaps:
(1) Change the K line.
(2) There is a price discontinuity while changing the K line.
For example, in the large gap above, the closing price of the previous K-line was 25821, and when switching lines, there was no quote in the middle. The opening price of the next K-line was 25762, forming a 59 point gap.
2. Two Situations that create a Gap in the Gap
Scenario 1: Stop trading and open trading to create a gap
The trend of the market is influenced by fundamentals, and there is a time difference between closing and opening. The market stops on the chart, but the fundamentals change within the time difference.
For example, the release of new economic data, such as political event that affect the fundamentals, will change market sentiment, and traders' judgment on the direction of the market trend may change. When the market opens again, it will form a gap.
Forex is traded 24 hours a day and with a large trading volume, it can remain active all the time. It is only closed on Saturdays and Sundays, so the short selling of forex is mainly concentrated on Monday when it opens.
Special instructions:
Stock index futures in forex trading are commodities that synchronize with the stock market and are closed and opened daily. For example, the Hang Seng Index, the Nikkei Index and the A50 FTSE Index often jump short at the daily opening.
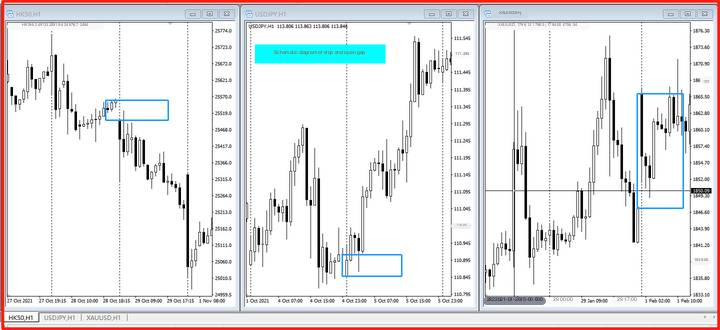
The following diagram is a schematic diagram of a jump formed by stopping and opening the market. On the left is the gap of the Hang Seng Index, in the middle is the gap of the dollar against the yen, and on the right is the gap of gold.
The following figure is a schematic diagram of the short circuit of the Shanghai and Shenzhen 300 index contracts in futures, with three short circuit gaps marked in a blue rectangle.

Scenario 2: Data Market Jump
The trend of trading will be affected by the economic data of various countries, especially when important economic data is released and important political event are released, there will be discontinuous quotations. There will be price jumps here, which mainly occur in Intraday Trading.
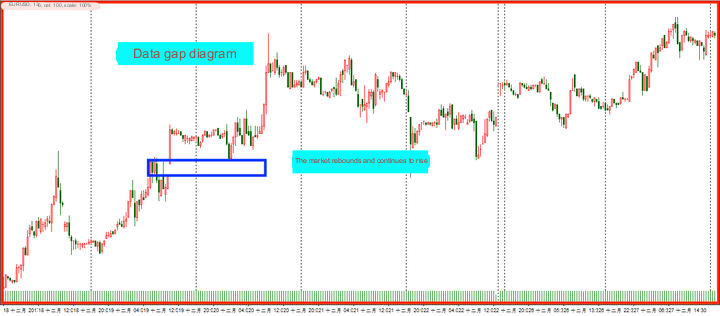
Look at the schematic diagram below.
 .
.
The upward bearish trend of the euro against the US dollar in the picture is influenced by the fundamental factors of the US House of Representatives' vote on the final version of the tax reform bill. After the upward bearish trend, the rebound gap continued to rise.
3. How to Trade Short Gaps?
The gap in the jump has the function of support and pressure. The upward gap has a supporting effect, while the downward gap has a pressure effect. In practice, the support pressure is used for trading.
The trading methods for different types of short gaps are basically the same. Next, I will give a few specific examples to illustrate the specific trading methods.
A: Stop and open short jump gap trading
After the opening of the market, there will be a gap in the market, waiting for the market to step back on the support and pressure position of the gap, and entering the market to long or short.
(1) Radical approach:
The price steps back into the range of support or pressure, and the order enters directly, with the stop loss placed at the high and low points ahead.
See the schematic diagram below.
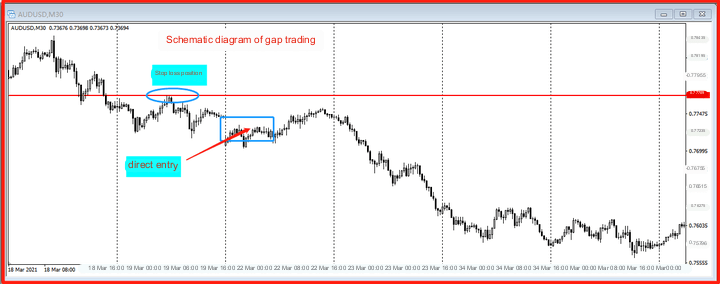
On the 30 minute K line chart of AUD/USD in the figure, there was an opening short. After the short break and low opening, the market began an upward correction within the day, with orders entering directly and stop losses set above the turning point of the red line in the figure. Subsequently, the market began to decline.
(2) Conservative approach
After the short opening, wait for the market to step back into the short range, forming a reverse k-line before entering, and the stop loss is set at the low point of the reverse k-line. This approach tends to be conservative in approach, with smaller stop loss space and a larger trading profit loss ratio.
Look at the diagram below, which shows the Hang Seng Index for more than 30 minutes.
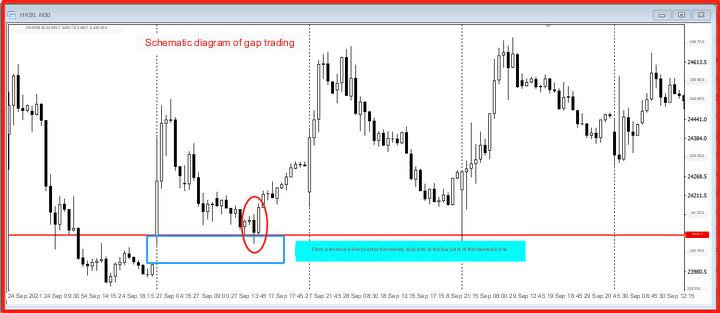
After the opening short jump, the market quickly rose and then fell significantly. When the market entered the gap support zone, a reverse K-line combination entered the market, with a stop loss set at the low point of the reverse K-line, and then the market rose.
B: Data market gap trading
Let's take a look at the schematic diagram below. This is a 30 minute K-line chart of the euro against the US dollar.
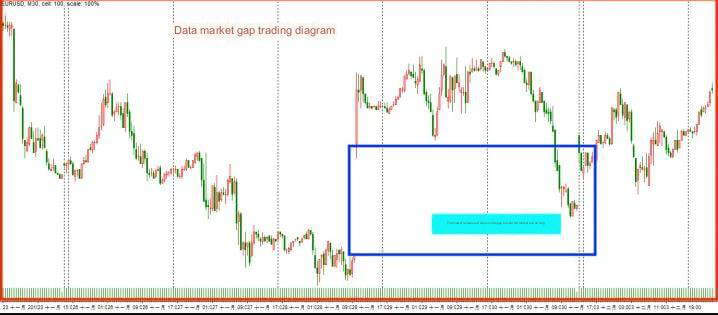
The short jump in the picture is due to the Brexit negotiations in the UK. When the event was announced, there was a very large short jump market, and after a day of high consolidation, the market returned to the short range, forming a reverse K-line Pattern, and then rose.
Note: After a short jump, there is no quick retracement, but a market that has been sorted and then retraced. The longer the sorting time, the higher the probability of a gap failure. It is recommended to use a conservative entry method, which is to wait for the reversal k line to be established before entering.
C: Futures short trading
Please take a look at the schematic diagram below, which shows the recent trend chart.

There were two short runs at the 1-hour level, with both short runs experiencing market retracement and downtrend.
After the first short jump, the market quickly rebounded and fell rapidly after establishment.
After the second short jump, the market underwent a long period of consolidation before stepping back, and once established, there was relatively little room for a downward trend.
Notes for futures trading:
For example, the trend of futures such as Crude Oil and gold is linked to that of external crude oil and gold. The external market fluctuates 24 hours a day, but domestic futures have three trading periods every day, with too frequent market closures and opening, resulting in too many short selling gaps.
This jump was not caused by the change of market sentiment or the influence of fundamental news, but by the suspension of opening. Therefore, the trading method of gap jumping is not performing well in these varieties, and attention should be paid in trading.
D: Gap trading in the stock market
In the stock market, the short jump gap is widely used. It is said that the Shanghai Composite Index has a trend characteristic of "filling every gap", and the technical methods of short jump gap can also be used in the stock market.
Please take a look at the schematic diagram below.
(1) When the first downward short jump gap appears above, the market establishes a short position. If you hold a stock at this time, you should close the position and stop the loss when the market steps back on the gap, which can avoid the losses caused by the next wave of market decline.
(2) After the second upward gap appears, wait for the market to establish a rebound and enter the market to buy stocks, followed by a significant increase in the market.
4. Precautions
(1) Validity period of gap jumping
After the formation of a jump gap, the shorter the time period for market rebound usage, the better the effectiveness of the gap.
(2) The effectiveness of the gap will be higher when it is combined with the support pressure and the resonance of the top and bottom form breaking.
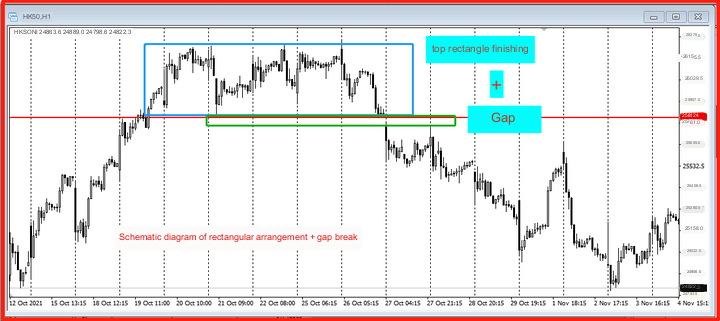
In practical practice, the market may experience a trend of short breaks, and at the same time, the market also forms a form of break. This form of break+resonance of the gap can increase the effectiveness of the gap.
Please take a look at the schematic diagram below.
At the same time as the rectangle at the top breaks down, there is a gap in the short jump. This break is firm and rapid, and the market quickly drops after stepping back on the gap.
(3) The increase or decrease in the gap can reach more than twice the gap.
The proportion of the gap in the overall trend is relatively small, usually the gap amplitude of a k line. A trend is usually composed of dozens of k lines, so once a short gap is established, the space formed after breaking out of the trend will usually reach more than twice the gap space. Trading suspension profit can be set according to this characteristic.
【 EBC Platform Risk Reminder and Disclaimer 】: There are risks in the market, and investment needs to be cautious. This article does not constitute investment advice.


 .
.


