A descending channel pattern is a powerful tool for traders seeking to capitalise on bearish trends. Mastering the skill to spot this pattern quickly can help you identify high-probability entry and exit points, manage risk, and anticipate potential reversals in the market.
What Is a Descending Channel Pattern?

A descending channel pattern, also known as a falling channel or channel down, is a technical chart formation that signals a prevailing downtrend in a security's price.
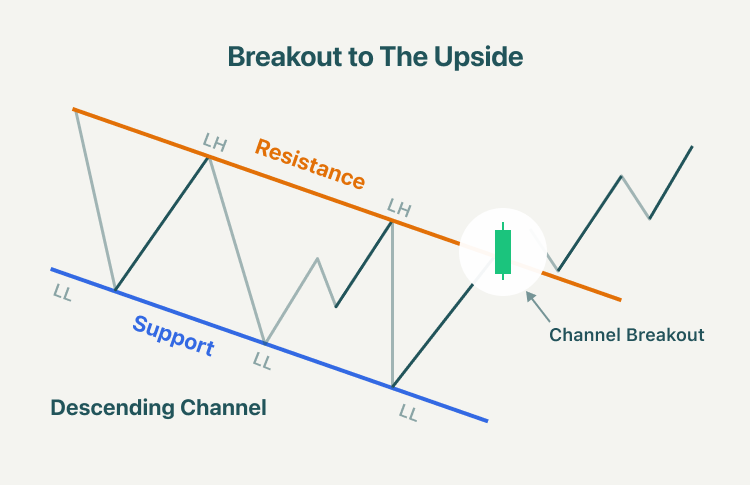
It is constructed by drawing two parallel downward-sloping trendlines: the upper line connects a series of lower highs (resistance), while the lower line connects a series of lower lows (support). The price typically oscillates between these boundaries, creating a channel that angles downward from left to right.
This pattern reflects a market where sellers consistently outweigh buyers, resulting in each rally being weaker than the last and each decline pushing prices lower. Traders use descending channels to identify both continuation of the bearish trend and potential reversal points.
Why Traders Track Descending Channels
Descending channels are valuable for several reasons:
Trend Confirmation: They confirm that the market is in a downtrend, helping traders align their strategies.
Entry and Exit Points: The pattern provides clear support and resistance levels for timing short entries or profit-taking.
Reversal Signals: Breakouts from the channel—especially to the upside—can signal an impending trend reversal.
How to Spot a Descending Channel Pattern Fast
Identifying a descending channel pattern quickly and accurately involves a systematic approach:
1. Look for a Clear Downtrend
Begin by scanning your price chart for a series of lower highs and lower lows. The descending channel pattern only forms in a market that is trending downward.
2. Draw the Upper Trendline
Identify at least two (ideally three or more) swing highs that are progressively lower. Connect these points with a straight line. This line forms the channel's resistance and should slope downward.
3. Draw the Lower Trendline
Next, locate at least two or three swing lows that are also moving lower. Draw a parallel line beneath the upper trendline, connecting these lows. This forms the channel's support.
4. Check for Parallelism and Touches
A valid descending channel requires the two lines to be roughly parallel. The more times the price touches each line without breaking through, the stronger and more reliable the pattern.
5. Confirm the Pattern
Ensure that price action remains within the channel boundaries for several swings. Occasional minor breaches can occur, but frequent or significant breaks may invalidate the pattern.
6. Watch for Volume and Candlestick Clues
Volume spikes or reversal candlestick patterns near the channel boundaries can provide additional confirmation for potential trades or impending breakouts.
Practical Example
Suppose you are analysing a daily chart of a major stock or currency pair. You notice that over the past month, each rally has failed to reach previous highs, and each decline has pushed the price lower. By connecting the recent lower highs and lower lows, you draw two parallel lines sloping downward. The price bounces between these lines several times, confirming the descending channel.
As the price approaches the upper trendline, you look for bearish reversal signals to enter a short trade. Conversely, if the price nears the lower trendline and shows signs of exhaustion or bullish reversal, you may consider taking profits or even preparing for a potential breakout to the upside.
Trading Strategies Using Descending Channels

1. Short at Resistance:
Enter short positions when the price touches the upper trendline and shows signs of rejection, such as bearish candlestick patterns or declining volume.
2. Take Profits at Support:
Close short trades or take profits as the price approaches the lower trendline, where bounces are likely.
3. Watch for Breakouts:
A breakout above the upper trendline may signal a reversal and a new bullish trend, while a breakdown below the lower trendline can indicate an acceleration of the downtrend.
4. Use Stop-Losses:
Always place stop-loss orders just outside the channel boundaries to protect against false breakouts or sudden reversals.
5. Combine with Indicators:
Enhance your analysis by using technical indicators such as moving averages, Relative Strength Index (RSI), or Bollinger Bands to confirm signals and gauge trend strength.
Common Mistakes to Avoid
Forcing the Pattern: Only draw a descending channel when the price action clearly supports it. Avoid fitting trendlines where they do not belong.
Ignoring Volume: Volume analysis can help validate the pattern's strength and the likelihood of a breakout.
Overlooking Higher Timeframes: Always check the pattern's context within the broader trend to avoid trading against major market moves.
Conclusion
Spotting a descending channel pattern fast can give traders a significant edge in bearish markets. By systematically identifying lower highs and lower lows, drawing parallel trendlines, and confirming with volume and candlestick analysis, you can quickly recognise this pattern and use it to inform your trading strategy. Remember to manage risk with stop-losses and to remain alert for breakout signals that may indicate a shift in trend.
Disclaimer: This material is for general information purposes only and is not intended as (and should not be considered to be) financial, investment or other advice on which reliance should be placed. No opinion given in the material constitutes a recommendation by EBC or the author that any particular investment, security, transaction or investment strategy is suitable for any specific person.


