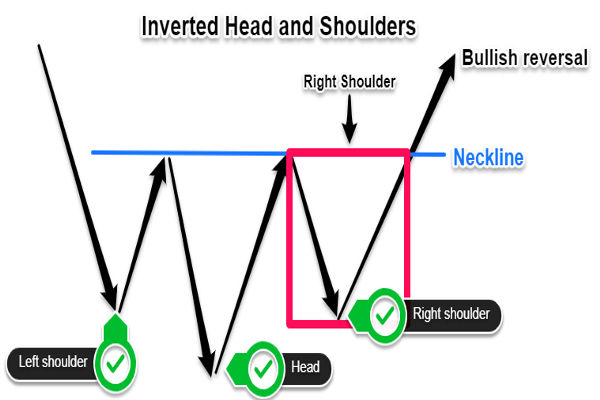
Master the Inverse Head and Shoulders pattern with this complete guide. Learn how to spot bullish reversals, confirm breakouts, and trade with confidence.
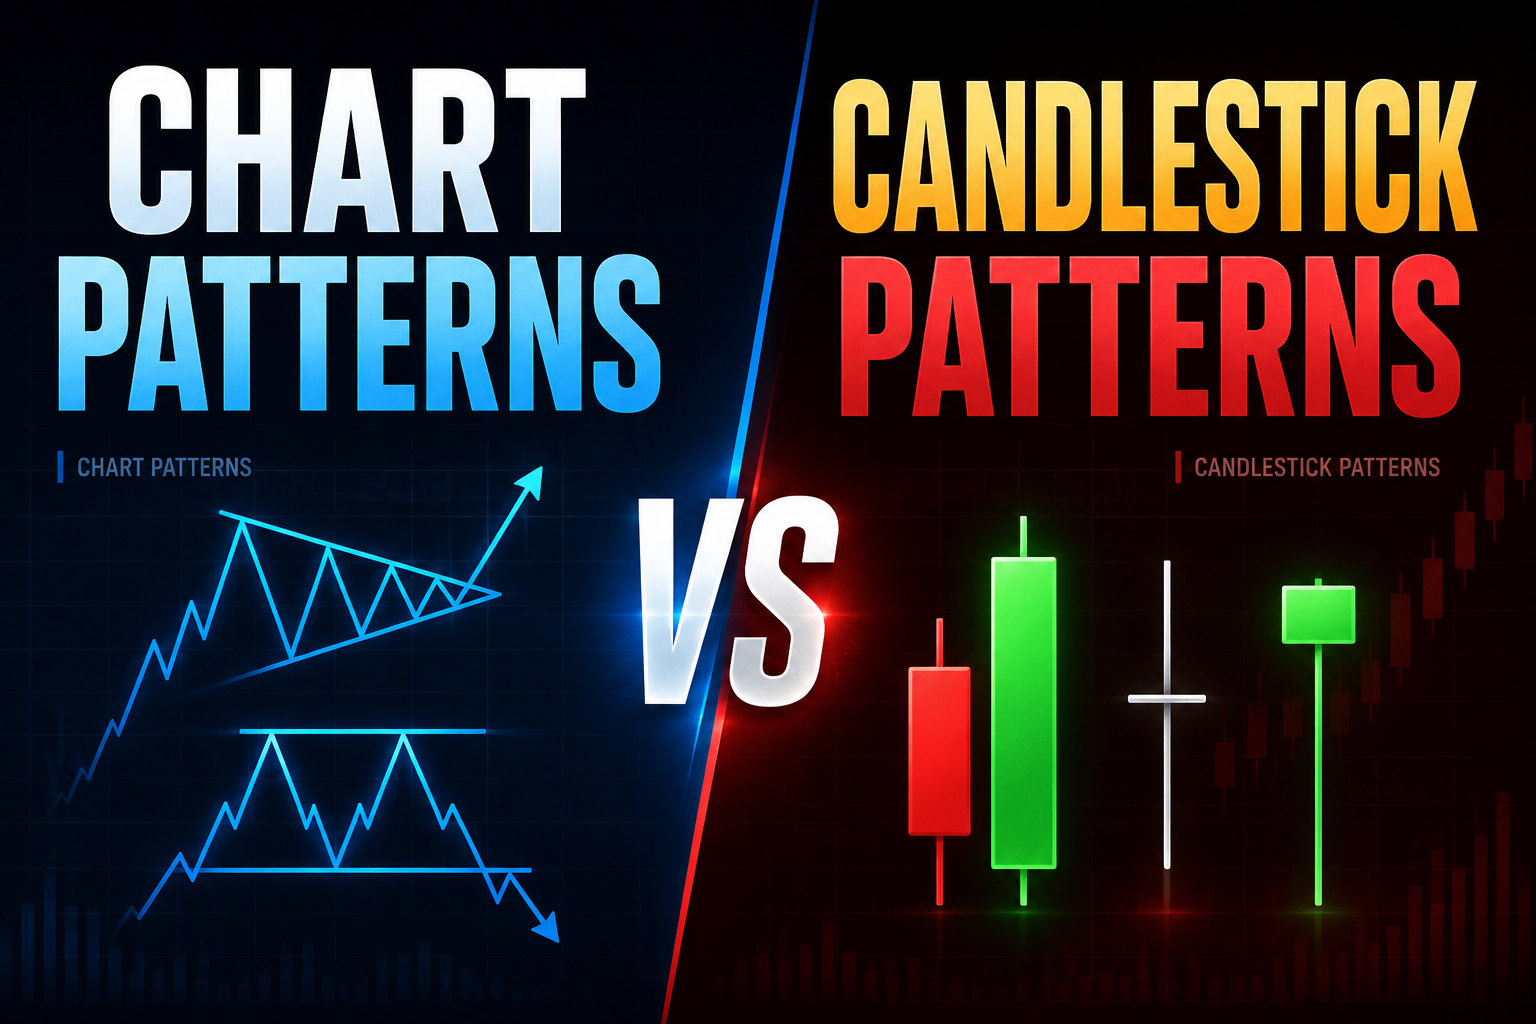
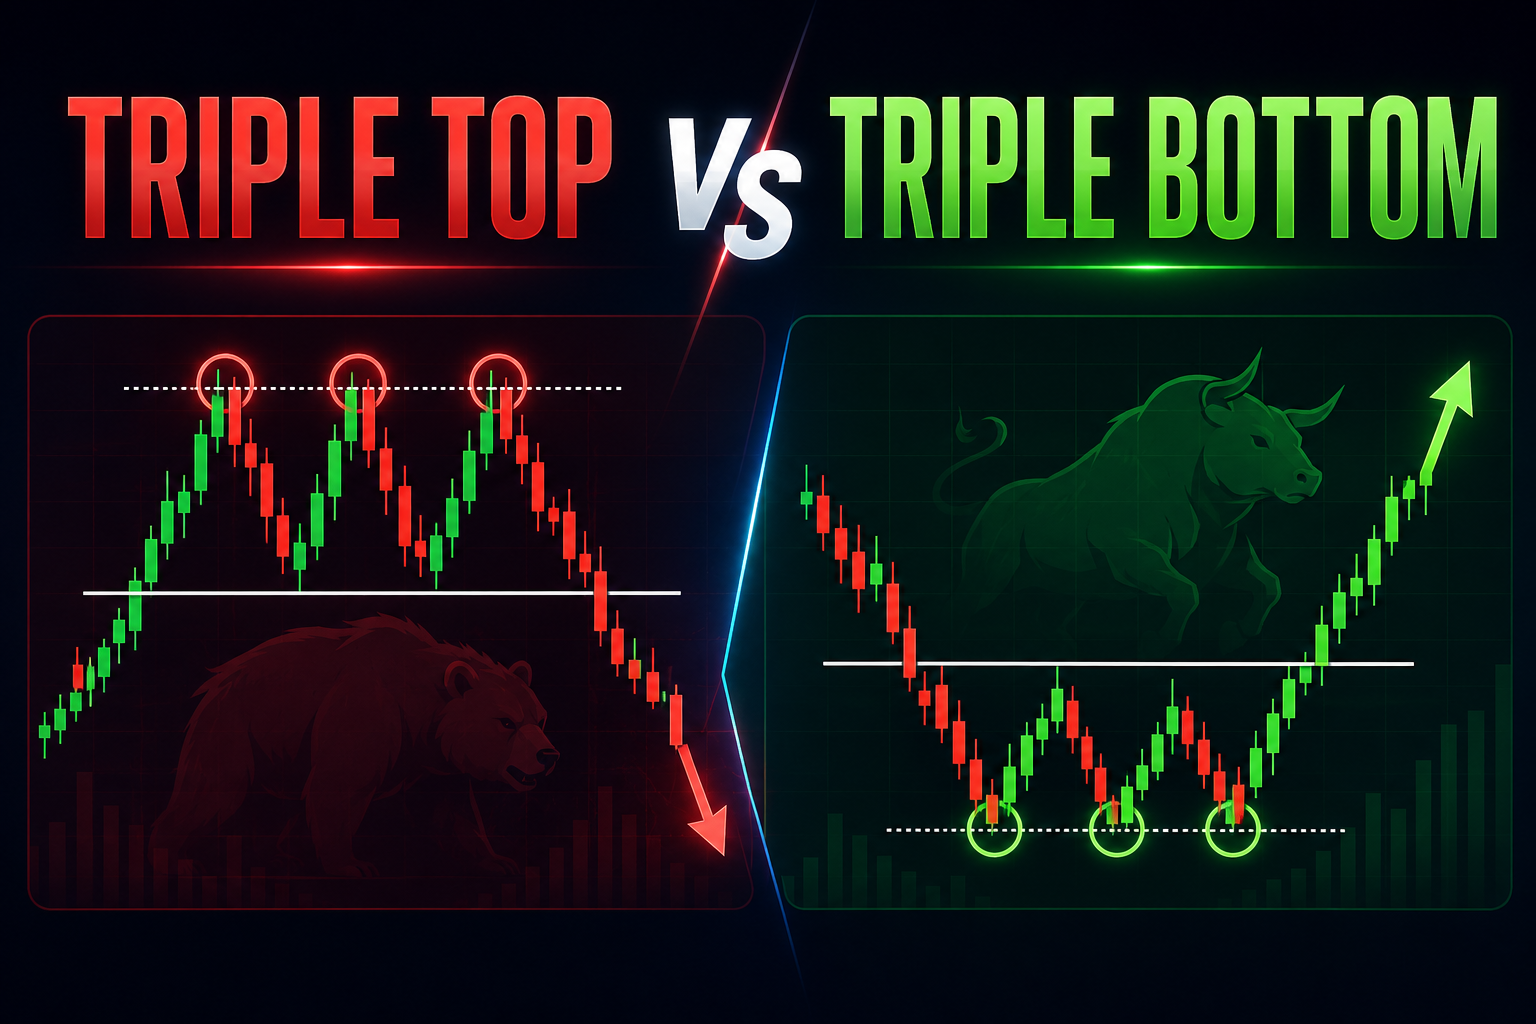
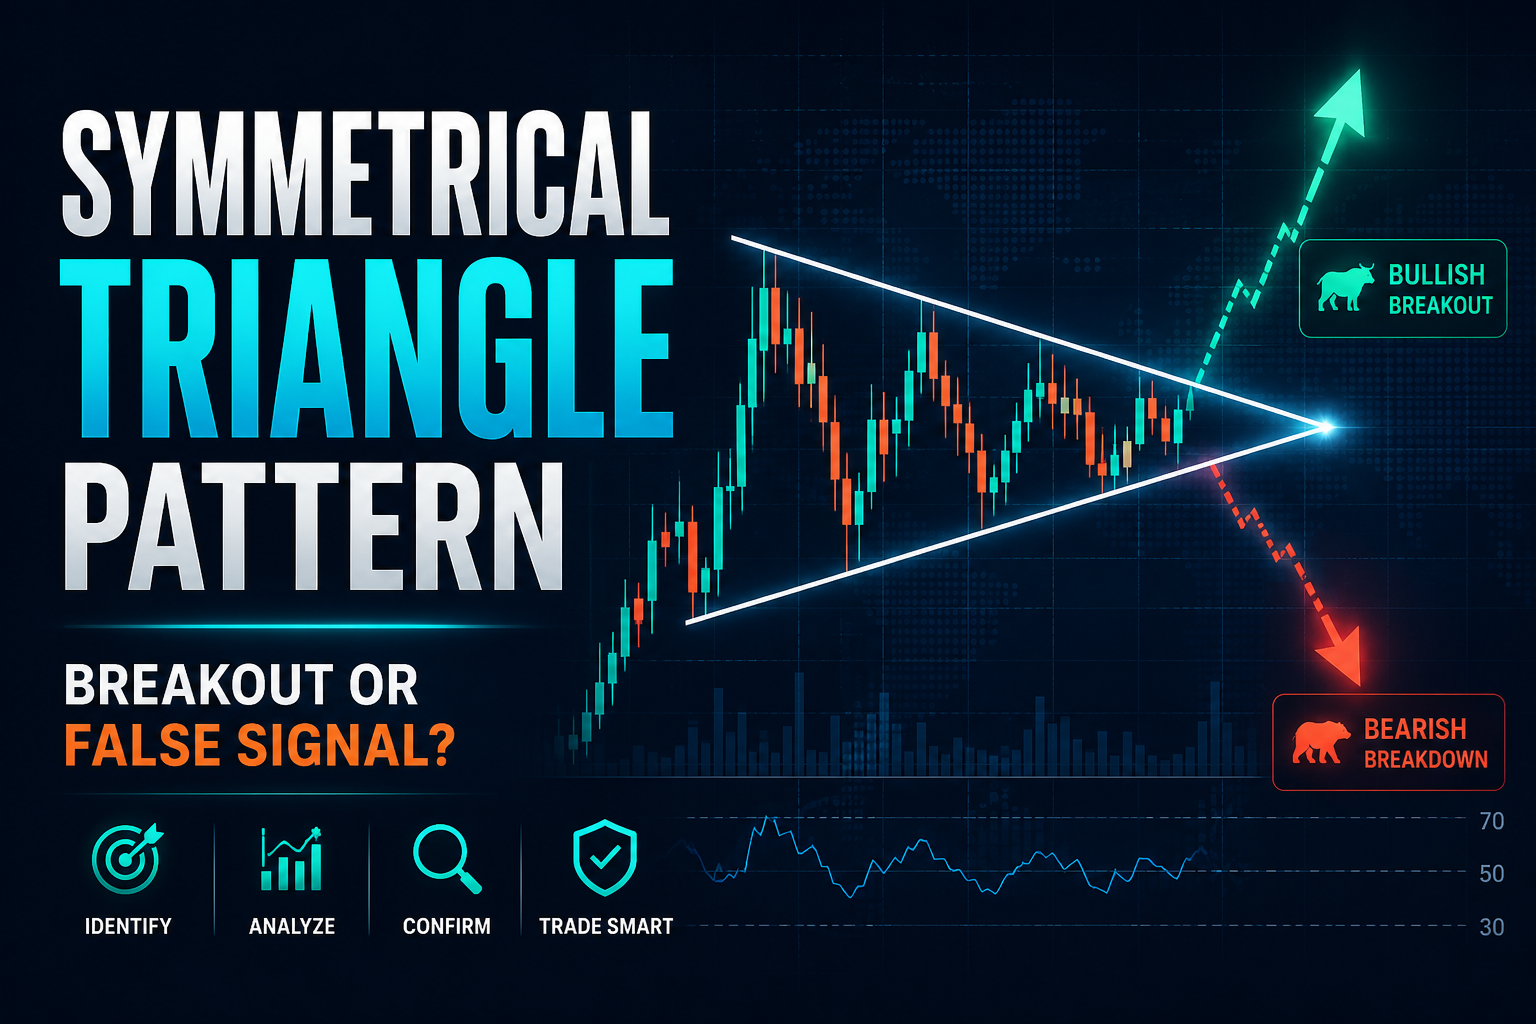
Compare chart patterns and candlestick patterns to understand how they differ, work together, and help traders confirm market direction and potential reversals.
Learn how CFD trading works, how margin and leverage are calculated, what it costs, the main risks, and where CFDs are regulated, with clear worked examples.
The AIPO ETF invests in AI power, grid and data-centre infrastructure. Review its latest holdings, 0.69% fee, performance, concentration and key risks.