Fibonacci retracement failure refers to the price rebound or callback
phenomenon in the market that does not conform to the Fibonacci retracement
ratio. Generally, the Fibonacci retracement ratio (such as 38.2%, 50%, or 61.8%)
is widely used in technical analysis as the basis for determining the degree of
price callback and looking for market support or resistance. However, when the
market ignores these callback proportions and shows trend price behavior, we can
say that the Fibonacci retracement fails. Traders should approach this situation
with caution and combine it with other technical indicators and trend
confirmation tools to reduce the risk of incorrect trading.
All support and resistance levels are temporary and will eventually be
breached. Fibonacci retracement also fails sometimes; it is not foolproof. Let's
take a specific example to see what happens when the Fibonacci retracement
fails. Here is a GBP/USD four-hour chart:
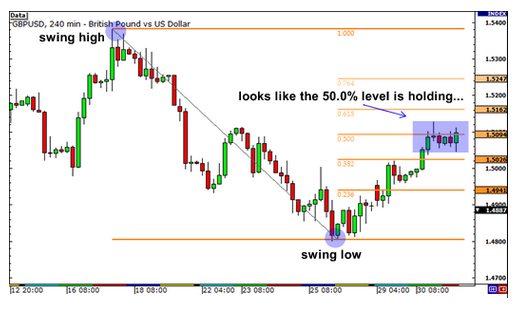
In the figure above, the market price is in a downward trend, so we open the
Fibonacci analysis tool to find entry opportunities. We found a high point of
1.5383 and a low point of 1.4799 in this band. We can see that the price
stagnates at the 0.500 Fibonacci retracement position, and the market has tested
this resistance level many times. At this point, many people will say, "Look,
the 0.500 pullback level has formed a strong resistance level! It's time to
shorten." Then they will short the pound at that pullback level and daydream,
waiting to make money with certainty!
If you really establish an empty order at the Fibonacci retracement position
and do not conduct proper risk management, not only will your daydream be
shattered, but your account will also be severely damaged. Looking at the
picture below, we can understand what exactly happened.
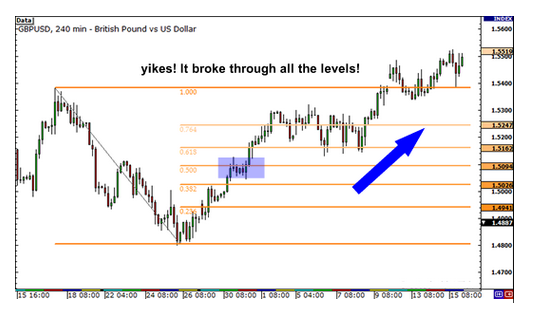
Obviously, the low point of this band is the bottom (trough) of this downward
trend. The market rebounded at this low point and broke through the important
Fibonacci retracement levels of 0.500, 0.618, and 0.764, or even soared all the
way to the highest point of 1.5383. What lessons has this case taught us?
Although the Fibonacci retracement position can indeed provide effective help
for our forex analysis and help us improve the success rate of
transactions, it is not foolproof, and sometimes it fails. We never know if
prices will experience a correction at the 0.382 correction level and then
resume an upward trend. Sometimes the price will fall back to 0.500 or 0.618,
but sometimes the price completely ignores Fibonacci and breaks through all the
resistance or support levels of Fibonacci. Please remember that the market does
not always pull back at these temporary resistance levels and then resume an
upward trend, but directly breaks through recent highs.
Another common question about using Fibonacci retracement to call back the position is how to determine and select the oscillation high and low points of this band. The selection of high and low points is the key to using the Fibonacci retracement position for forex analysis because the high and low points we select directly determine the correctness of our analysis results.
In fact, there is no absolutely correct method to determine the high and low points of the band, especially when the Market trend on the chart is not particularly clear. Therefore, the mapping of the Fibonacci retracement position sometimes becomes a guessing game. Therefore, in order to improve our trading success rate, we must constantly hone our trading skills and use Fibonacci analysis tools together with other trading analysis tools.
Usually, traders may observe charts from different angles and within different time frames, and their fundamental preferences may also vary. Therefore, they may have completely different views on the selection of high and low points in the band.
Disclaimer: Investment involves risk. The content of this article is not an investment advice and does not constitute any offer or solicitation to offer or recommendation of any investment product.
